. 2014 Jun 10;111(23):8428-33.
doi: 10.1073/pnas.1406855111. Epub 2014 May 21.

Prokaryotic NavMs channel as a structural and functional model for eukaryotic sodium channel antagonism

Affiliations

Prokaryotic NavMs channel as a structural and functional model for eukaryotic sodium channel antagonism

Claire Bagnéris et al. Proc Natl Acad Sci U S A. .

Abstract

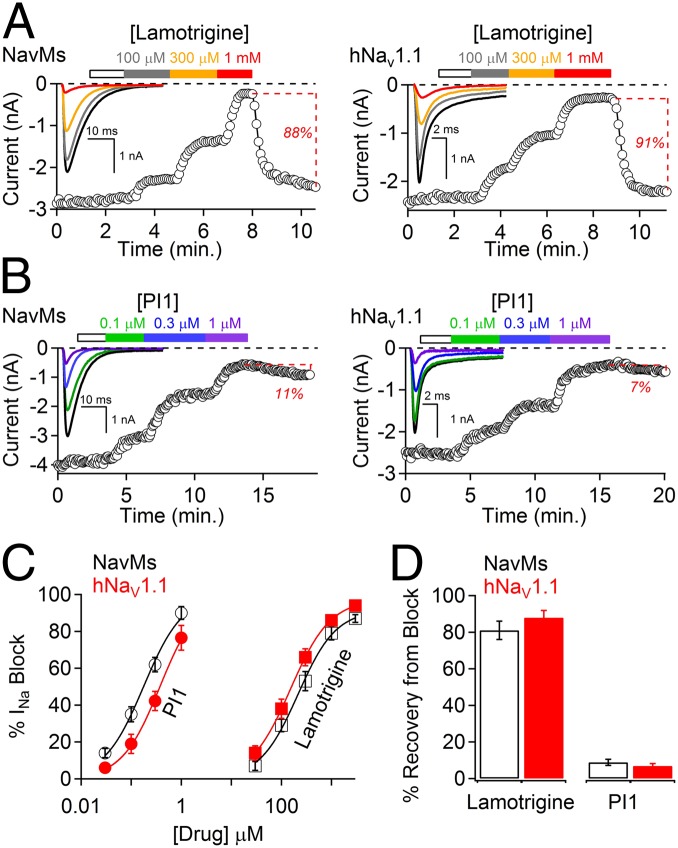
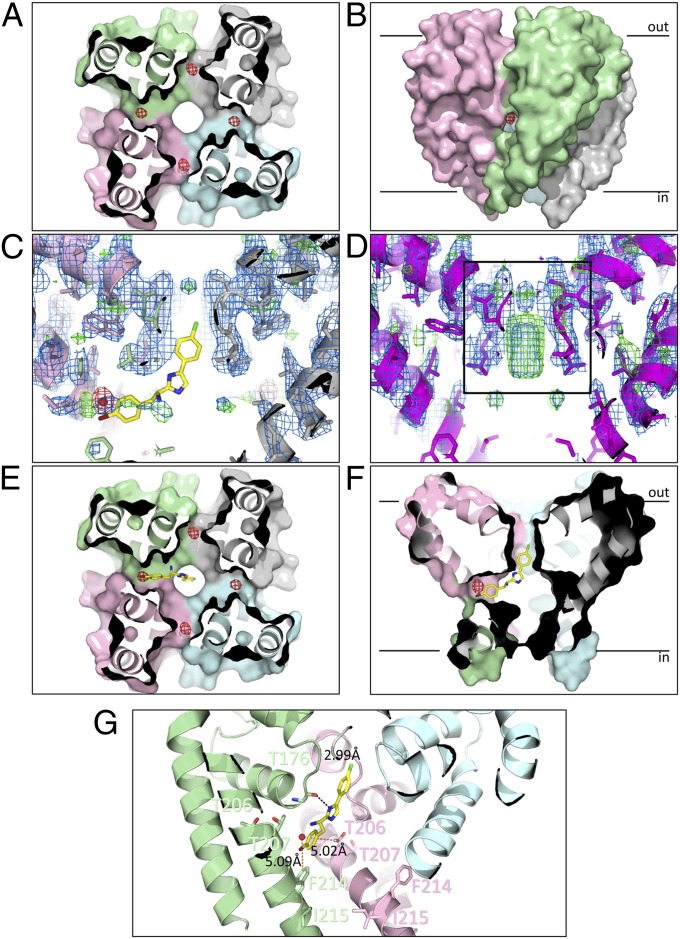
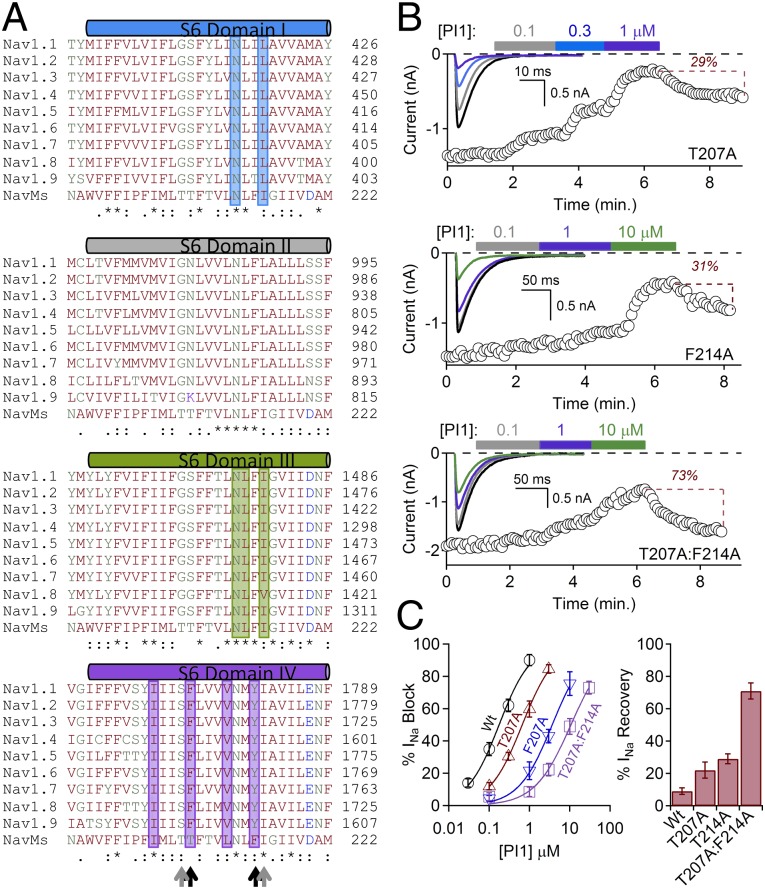
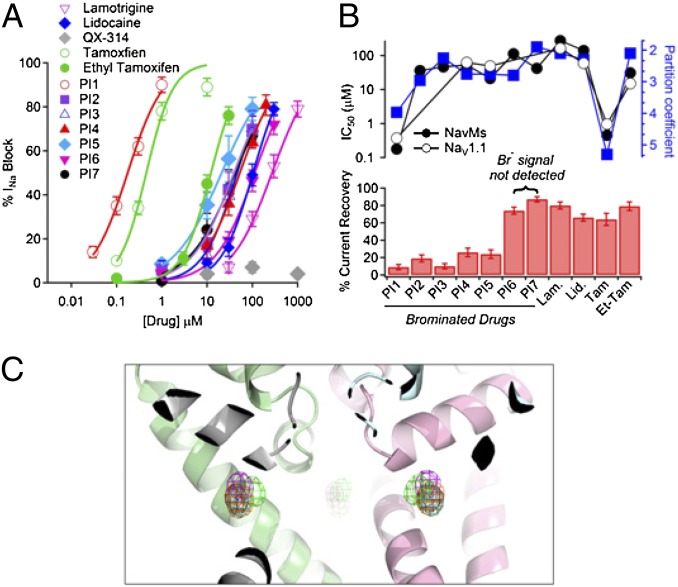
Voltage-gated sodium channels are important targets for the development of pharmaceutical drugs, because mutations in different human sodium channel isoforms have causal relationships with a range of neurological and cardiovascular diseases. In this study, functional electrophysiological studies show that the prokaryotic sodium channel from Magnetococcus marinus (NavMs) binds and is inhibited by eukaryotic sodium channel blockers in a manner similar to the human Nav1.1 channel, despite millions of years of divergent evolution between the two types of channels. Crystal complexes of the NavMs pore with several brominated blocker compounds depict a common antagonist binding site in the cavity, adjacent to lipid-facing fenestrations proposed to be the portals for drug entry. In silico docking studies indicate the full extent of the blocker binding site, and electrophysiology studies of NavMs channels with mutations at adjacent residues validate the location. These results suggest that the NavMs channel can be a valuable tool for screening and rational design of human drugs.

Keywords: crystal structure; pharmacology.


Conflict of interest statement

The authors declare no conflict of interest.

Figures

Fig. 1.
Fig. 1.
Comparison of lamotrigine and PI1 effects on NavMs and human Nav1.1 channels. (A) HEK-293T cells transfected with either (Left) NavMs or (Right) hNav1.1 were patch clamped in the whole-cell configuration. (Insets) Voltage-gated Na+ currents activated by a 0.2-Hz train of 0.5-s depolarizations to −30 from −180 mV for NavMs and 0.1-s depolarizations to −10 from −120 mV for Nav1.1. The onset of block was assessed after 2 min extracellular application of drug at concentrations as indicated by the colored boxes. The white boxes are the control application of 0.1% DMSO at the maximum concentration used as a vehicle for the compound. Percentage of current recovery is denoted by the dotted lines (±SEM, n = 4–5 cells). (B) PI1 effects on NavMs and hNav1.1 channel functions (same conditions as in A). (C) Concentration–INa block relationships (±SEM, n = 4–6 cells) for both lamotrigine and PI1 for both NavMs and hNav1.1 channels are shown. IC50 was estimated by fitting the average percent current block to the Hill equation. The IC50 values for Nav1.1 block by lamotrigine and PI1 were 196 μM and 373 nM, respectively. The IC50 values for NavMs block by lamotrigine and PI1 were 273 μM and 178 nM, respectively. (D) Percent recovery of sodium current after <70% current block by 1 mM lamotrigine or 1 μM PI1. Examples of current recovery are denoted by the red text and dotted lines in A and B (±SEM, n = 4–6 cells).
Fig. 2.
Fig. 2.
Binding site of PI1 in the NavMs pore. (A) Crystal structure of the NavMs-pore in complex with PI1. The four monomers are depicted in different colors in surface representation. The view is a slice through the middle of the structure, in the cavity region, viewed from the bottom of the pore. The anomalous difference map (which indicates the locations of the bromine atoms at the top of the cavity) is overlaid as a red mesh contoured at 3 σ and corresponds with ∼0.3 occupancy/site. (B) Side view of the pore showing the anomalous difference density location adjacent to the entrance of one of the transmembrane fenestrations, between two monomers. For reference, the black bars indicate the approximate locations of the top and bottom of the bilayer. (C) Side view slice through the middle of the pore, showing the lack of density in the SF (indicated by the black box in D) for the PI1 cocrystals. The protein structure (in cartoon, ribbon, and stick representation) is overlaid with (2Fo-Fc) and (Fo-Fc) difference electron density maps contoured at 1.5 σ (blue) and 3 σ (green), respectively. The anomalous difference map contoured at 5 σ is shown in red. The best docked position of PI1 is shown in stick representation, for reference. (D) View as in C but for the apo crystals. The density in the center of the SF corresponds to sodium ions (28). (E and F) In silico docking results using the apo NavMs-pore structure and PI1. The position of the best predicted site (in stick representation) is overlaid on a surface representation of the protein crystal structure, with the position of the bromine in the cocrystals indicated as a solid red ball) and the anomalous density map (red mesh). The distal end of PI1 protrudes into the bottom of the SF. E corresponds to a side view of a slice through the center of the channel (corresponding to the direction in A), whereas F corresponds to a slice through the center from the perpendicular direction (which corresponds to the direction of the view seen in B). (G) Detailed view of the PI1 binding pocket. The locations of the residues that were mutated for the functional studies (T207 and F214, which effect block, and T206 and I215, which do not), and their distances to the crystallographically-located bromine atom are indicated by orange dashed lines. The hydrogen bond between the imidazole nitrogen of PI1 and the Thr176 main chain carbonyl group predicted from docking is shown as a black dashed line.
Fig. 3.
Fig. 3.
Mutational effects on NavMs blocker efficacy. (A) Multiple sequence alignments of the S6 helices of NavMs (UnitProt A0L5S6) and the four domains of human Navs (UnitProt P35498 for Nav1.1, Q99250 for Nav1.2, Q9NY46 for Nav1.3, P35499 for Nav1.4, Q14524 for Nav1.5, Q9UQD0 for Nav1.6, Q15858 for Nav1.7, Q9Y5Y9 for Nav1.8, and Q9UI33 for Nav1.9). The residues in the human channels shown by site-directed mutagenesis to be important for drug binding are highlighted by the color of their domains (blue bar for domain I, dark gray for domain II, dark green for domain III, and purple for domain IV). Residues where the NavMs and human Navs are identical are denoted by “*” in the bottom rows; conservative substitutions are denoted by “:” and “.” Residue names are colored by residue type. Residues mutated in NavMs in this study are indicated by black arrows (those that produce effects) and gray arrows (those that do not produce effects). (B) Effects of PI1 on mutated channels T207A (Top), F214A (Middle), and the T207A:F214A (Bottom) double mutant. F214A and T207A:F214A channels were depolarized for 1 s to compensate for the slower inactivation intrinsic to the mutated channels. (Insets) Sodium currents activated by a 0.2-Hz train of 0.5-s depolarizations to −30 from −180 mV in control and in conditions where extracellular PI1 was applied (colored boxes). Graphs depict the time course of INa block by 2–3 min applications of PI1. (C) (Left) Reduction in potency for PI1 due to the T207A and the F214A and the T207:F214 double mutations (±SEM, n = 4–6 cells). (Right) Magnitudes of recovery from block by PI1 for each of these mutants after bath exchange for 3–5 min.
Fig. 4.
Fig. 4.
Binding of other channel blockers. (A) Comparisons of the channel-blocking effects of compounds listed in Table 1. Plots of drug concentrations versus block of the NavMs current were fit by the Hill equation. The IC50s are listed in Table 1 (±SEM, n = 4–8 replicates). (B) Comparisons of channel blocker potencies, hydrophobicities, and recoveries from block for compounds listed in Table 1. (Upper) The potencies (IC50) for NavMs (filled circles) and hNav1.1 (open circles), and octanol:water partition coefficient log P (blue squares) are plotted for each drug listed in the lower panel. (Lower) Percentage of current recovered after ≥60% sodium current block. (C) The structure of the NavMs-pore (ribbon representation with the same monomer colors as in Fig. 2) overlaid with the anomalous difference maps contoured at 5 σ for compounds PI1 to PI5 (red for PI1, cyan for PI2, magenta for PI3, yellow for PI4, green for PI5), showing the similarity of the positions of the bromine atoms.

References

    1. Catterall WA, Goldin AL, Waxman SG. International Union of Pharmacology. XLVII. Nomenclature and structure-function relationships of voltage-gated sodium channels. Pharmacol Rev. 2005;57(4):397–409. - PubMed
    1. Payandeh J, Scheuer T, Zheng N, Catterall WA. The crystal structure of a voltage-gated sodium channel. Nature. 2011;475(7356):353–358. - PMC - PubMed
    1. McCusker EC, et al. The open conformation of a voltage-gated sodium channel reveals the transmembrane pathway and mechanism of channel opening and closing. Nat Commun. 2012;3:1102. - PMC - PubMed
    1. Bagnéris C, et al. Role of the C-terminal domain in the structure and function of tetrameric sodium channels. Nat Commun. 2013;4:2465. - PMC - PubMed
    1. Payandeh J, Gamal El-Din TM, Scheuer T, Zheng N, Catterall WA. Crystal structure of a voltage-gated sodium channel in two potentially inactivated states. Nature. 2012;486(7401):135–139. - PMC - PubMed

Publication types

MeSH terms