. 2015 Jul 10;290(28):17085-95.
doi: 10.1074/jbc.M115.651190. Epub 2015 May 15.

Integration of Fourier Transform Infrared Spectroscopy, Fluorescence Spectroscopy, Steady-state Kinetics and Molecular Dynamics Simulations of Gαi1 Distinguishes between the GTP Hydrolysis and GDP Release Mechanism

Affiliations

Integration of Fourier Transform Infrared Spectroscopy, Fluorescence Spectroscopy, Steady-state Kinetics and Molecular Dynamics Simulations of Gαi1 Distinguishes between the GTP Hydrolysis and GDP Release Mechanism

Grit Schröter et al. J Biol Chem. .

Abstract

Gα subunits are central molecular switches in cells. They are activated by G protein-coupled receptors that exchange GDP for GTP, similar to small GTPase activation mechanisms. Gα subunits are turned off by GTP hydrolysis. For the first time we employed time-resolved FTIR difference spectroscopy to investigate the molecular reaction mechanisms of Gαi1. FTIR spectroscopy is a powerful tool that monitors reactions label free with high spatio-temporal resolution. In contrast to common multiple turnover assays, FTIR spectroscopy depicts the single turnover GTPase reaction without nucleotide exchange/Mg(2+) binding bias. Global fit analysis resulted in one apparent rate constant of 0.02 s(-1) at 15 °C. Isotopic labeling was applied to assign the individual phosphate vibrations for α-, β-, and γ-GTP (1243, 1224, and 1156 cm(-1), respectively), α- and β-GDP (1214 and 1134/1103 cm(-1), respectively), and free phosphate (1078/991 cm(-1)). In contrast to Ras · GAP catalysis, the bond breakage of the β-γ-phosphate but not the Pi release is rate-limiting in the GTPase reaction. Complementary common GTPase assays were used. Reversed phase HPLC provided multiple turnover rates and tryptophan fluorescence provided nucleotide exchange rates. Experiments were complemented by molecular dynamics simulations. This broad approach provided detailed insights at atomic resolution and allows now to identify key residues of Gαi1 in GTP hydrolysis and nucleotide exchange. Mutants of the intrinsic arginine finger (Gαi1-R178S) affected exclusively the hydrolysis reaction. The effect of nucleotide binding (Gαi1-D272N) and Ras-like/all-α interface coordination (Gαi1-D229N/Gαi1-D231N) on the nucleotide exchange reaction was furthermore elucidated.

Keywords: Fourier transform IR (FTIR); GTPase; enzyme mechanism; fluorescence; heterotrimeric G protein; molecular dynamics; mutagenesis; nucleotide exchange.


Figures

FIGURE 1.
FIGURE 1.
i1 is switched on by the exchange of GDP for GTP (koff/kon), then GTP hydrolysis proceeds (khyd) and Pi is released. Multiple turnover kinetics were measured via HPLC, which cannot distinguish between the three processes. Nucleotide exchange kinetics (koff/kon) were monitored via tryptophan fluorescence spectroscopy. Single turnover kinetics (khyd) were measured via time-resolved FTIR difference spectroscopy.
FIGURE 2.
FIGURE 2.
SDS-PAGE of wild type and mutant Gαi1 and wild type RGS4 proteins after purification. 2.5 μg of wild type and mutant Gαi1 and wild type RGS4 was loaded on a 12.5% polyacrylamide SDS gel together with Page Ruler Unstained Protein Ladder (Thermo Fisher Scientific, Waltham, MA) as size standard. Chromatography runs were performed with 60 mA for 30 min and staining was performed using Coomassie Brilliant Blue.
FIGURE 3.
FIGURE 3.
Three-dimensional spectrum (global fit) of Gαi1-WT. The first spectrum represents the photolysis spectrum, subsequently hydrolysis takes place and was monitored. Time dependence of the bands at 1155 cm−1 (gray) and 1078 cm−1 (blue) is indicated. The absorbance change of these bands is shown in Fig. 4.
SCHEME 1.
SCHEME 1.
Reaction scheme observed in FTIR measurements.
FIGURE 4.
FIGURE 4.
Kinetics of FTIR measurements of the hydrolysis reaction in Gαi1 at 15 °C on the basis of the bands for disappearing γ-GTP (1155 cm−1) and appearing as free phosphate (1078 cm−1) (see band assignment (Fig. 6)). Solid lines represent the monoexponential global fit, dots represent data points.
FIGURE 5.
FIGURE 5.
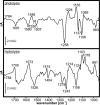
Photolysis and hydrolysis spectrum of Gαi1. Bands facing downward in the photolysis spectrum represent the pHPcgGTP state of Gαi1, bands facing upward depict the GTP bound state. Bands facing downward and upward in the hydrolysis spectrum represent the educt and product state of the hydrolysis reaction that takes place in Gαi1, respectively. The spectral region between 1680 and 1620 cm−1 is superimposed by water absorptions and not further regarded.
FIGURE 6.
FIGURE 6.
Band assignment via isotopically labeled α-18O2-pHPcgGTP, β-18O3-pHPcgGTP, and γ-18O4-NPEcgGTP of the photolysis (A) and hydrolysis (C) reaction of Gαi1 at 15 °C. Measurements with NPEcgGTP were scaled by the factor of 5 (photolysis) or 10 (hydrolysis). Arrows indicate band shifts caused by the 18O isotopes. Double differences (B and D) represent measurements with labeled minus unlabeled nucleotides and reveal the band shift only. The positions of 18O labeling are depicted in panel E. The 18O-labeled phosphoester in γ-18O4-NPEcgGTP leads to β-18O1-GDP, corresponding band shifts are marked in cyan.
FIGURE 7.
FIGURE 7.
Kinetics of the GTPase reactions of intrinsic Gαi1 and Gαi1·RGS4 measured via FTIR spectroscopy (β-GDP band at 5 °C)
FIGURE 8.
FIGURE 8.
Positions of the investigated mutants in Gαi1 (PDB code 1GIA) (5). The Ras-like domain is depicted in beige, the all-α domain in yellow, and the nucleotide in gray. Switch regions are colored red (switch I, residues 178–188), dark green (switch II, residues 202–218), and light green (switch III, residues 230–241). The p-loop (residues 40–47) is colored in cyan. Investigated mutants are located in the interface of the two domains (D229, blue; D231, orange), the phosphate binding region (R178, magenta), and the guanosine binding region (D272, green). Direct binding partners are colored by domain and by element; black dashed lines represent H-bonds. Switch definitions were adapted from Ref. . Colors of the mutants are retained hereafter.
FIGURE 9.
FIGURE 9.
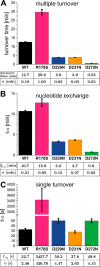
Summary of the results of multiple turnover measurements via HPLC at 30 °C (A), nucleotide exchange experiments via fluorescence spectroscopy at 30 °C (B) and single turnover hydrolysis measurements via FTIR spectroscopy at 15 °C (C) of wild type and mutant Gαi1.
FIGURE 10.
FIGURE 10.
Negative control of the mutant Gαi1-W211A in fluorescence spectroscopy. After baseline monitoring for 5 min, 2.5 μm GTPγS (×5 molar excess) was added to trigger nucleotide exchange.
FIGURE 11.
FIGURE 11.
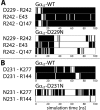
Contact matrix analysis of the molecular interactions taking place in the surrounding of Asp229 (D229) (WT) and the mutant D229N (A) or Asp231 (D231) (WT) and its mutant D231N (B) during a MD simulation. Black bars indicate H-bonds, white spaces indicate no H-bond formation.
FIGURE 12.
FIGURE 12.
Advanced Ras-like/all-α interdomain binding model of Gαi1. In contrast to the crystal structures, Asp231 (D231) forms an interdomain H-bond to Arg144 (D144). Arg242 (R242) is stabilized by Asp229 (D229) and thereby forms an H-bond to Gln147 (Q147). Ras-like domain is shown in beige, all-α domain in yellow, and GTP in gray balls and sticks.

References

    1. Milligan G., Kostenis E. (2006) Heterotrimeric G-proteins: a short history. Br. J. Pharmacol. 147, S46–55 - PMC - PubMed
    1. Sato M., Blumer J. B., Simon V., Lanier S. M. (2006) Accessory proteins for G proteins: partners in signaling. Annu. Rev. Pharmacol. Toxicol. 46, 151–187 - PubMed
    1. Tall G. G., Krumins A. M., Gilman A. G. (2003) Mammalian Ric-8A (synembryn) is a heterotrimeric Gα protein guanine nucleotide exchange factor. J. Biol. Chem. 278, 8356–8362 - PubMed
    1. Garcia-Marcos M., Ghosh P., Farquhar M. G. (2009) GIV is a nonreceptor GEF for Gαi with a unique motif that regulates Akt signaling. Proc. Natl. Acad. Sci. U.S.A. 106, 3178–3183 - PMC - PubMed
    1. Coleman D. E., Berghuis A. M., Lee E., Linder M. E., Gilman A. G., Sprang S. R. (1994) Structures of active conformations of Giα1 and the mechanism of GTP hydrolysis. Science 265, 1405–1412 - PubMed

Publication types

MeSH terms

Substances