. 2019 Nov 1;294(44):15973-15986.
doi: 10.1074/jbc.RA119.010619. Epub 2019 Sep 9.

A subfamily roadmap of the evolutionarily diverse glycoside hydrolase family 16 (GH16)

Affiliations

A subfamily roadmap of the evolutionarily diverse glycoside hydrolase family 16 (GH16)

Alexander Holm Viborg et al. J Biol Chem. .

Abstract

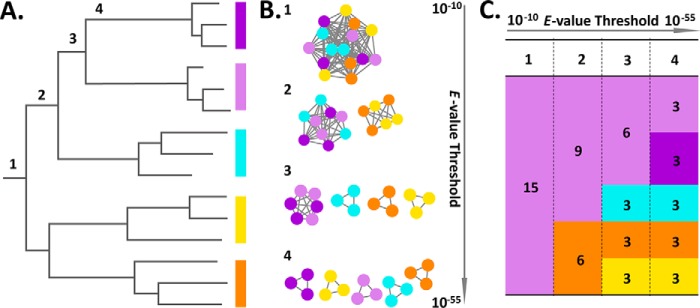
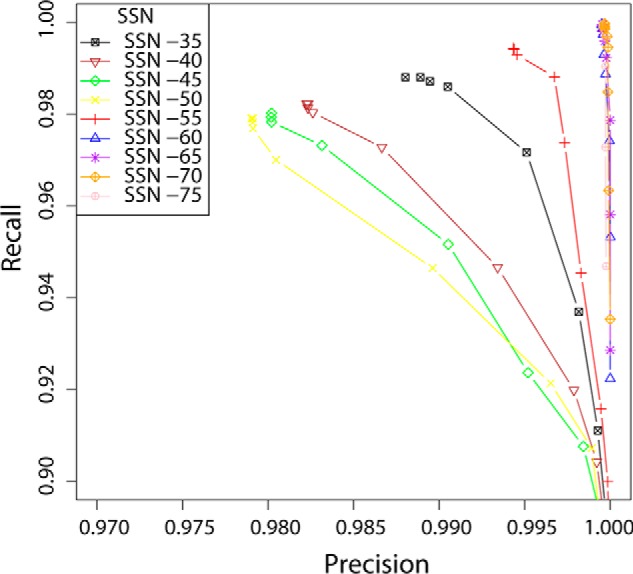
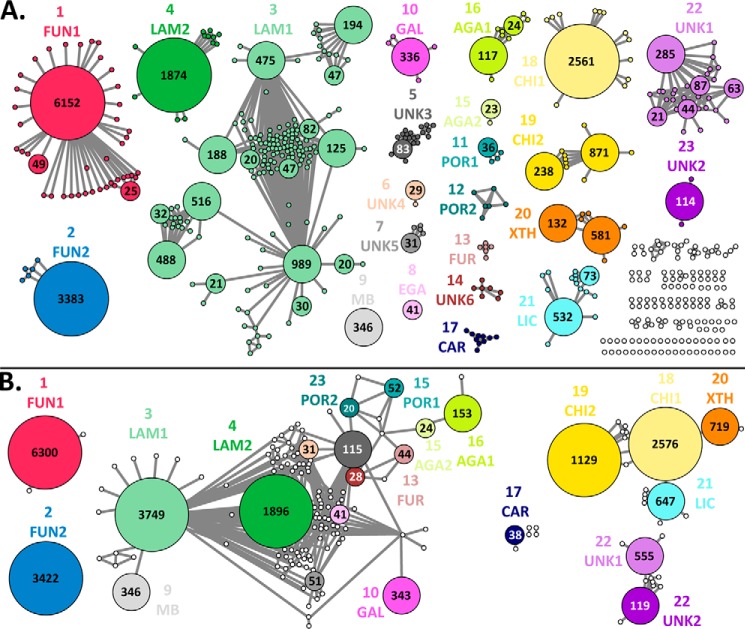
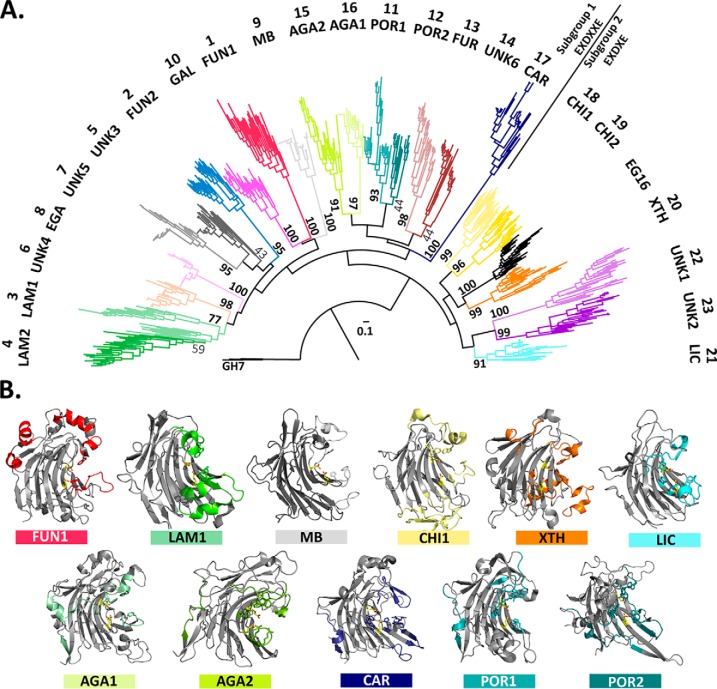
Glycoside hydrolase family (GH) 16 comprises a large and taxonomically diverse family of glycosidases and transglycosidases that adopt a common β-jelly-roll fold and are active on a range of terrestrial and marine polysaccharides. Presently, broadly insightful sequence-function correlations in GH16 are hindered by a lack of a systematic subfamily structure. To fill this gap, we have used a highly scalable protein sequence similarity network analysis to delineate nearly 23,000 GH16 sequences into 23 robust subfamilies, which are strongly supported by hidden Markov model and maximum likelihood molecular phylogenetic analyses. Subsequent evaluation of over 40 experimental three-dimensional structures has highlighted key tertiary structural differences, predominantly manifested in active-site loops, that dictate substrate specificity across the GH16 evolutionary landscape. As for other large GH families (i.e. GH5, GH13, and GH43), this new subfamily classification provides a roadmap for functional glycogenomics that will guide future bioinformatics and experimental structure-function analyses. The GH16 subfamily classification is publicly available in the CAZy database. The sequence similarity network workflow used here, SSNpipe, is freely available from GitHub.

Keywords: Hidden Markov Model (HMM); beta-jelly-roll fold; beta-sandwich; carbohydrate-active enzymes (CAZymes); enzyme structure; glycoside hydrolase; phylogenetics; protein evolution; sequence similarity networks (SSN); structural biology.


Conflict of interest statement

The authors declare that they have no conflicts of interest with the contents of this article

Figures

Figure 1.
Figure 1.
Subfamily delineation based on distinct analysis/representation. This artificial example of 15 sequences to be classified into subfamilies illustrates the relationships between distinct representation and analysis. The numbers 1–4 indicate four hypothetical subfamily classifications that are concordant in all three representations. A, evolutionary tree. Reconstruction from a phylogenetic analysis or hierarchical clustering. Subfamily delineation consists of drawing a vertical line (below numbers 1–4) and making a family for each outcoming branch. B, SSN connection graph. SSNs with sequences represented as nodes (circles) and all pairwise sequence relationships (alignments) above a defined E-value threshold indicated with edges (lines). At increased thresholds (numbers 1–4), the connected components break up into an increasing number of subcomponents, representing putative subfamily delineations (16). C, SSN tabular summary. Each column (numbers 1–4 for each E-value threshold, separated by a vertical dashed line) depicts a distinct subfamilization and displays the number of clusters/subfamilies as colored boxes and the number of members/sequences in each cluster/subfamily.
Figure 2.
Figure 2.
Summary of GH16 sequence similarity networks. Summary of the subfamilies created in SSNs under thresholds from E = 10−5 to 10−65. The top row indicates the SSN clustering threshold defining each column (e.g. “35” corresponds to an E-value threshold of 10−35). The rows represent the emergent subfamilies (colored individually) and their stability across thresholds. Labels in the subfamilies indicate the number of sequence members as well as the taxonomic range. ASC, Ascomyocota; BAC, Bacteria; BACTD, Bacteroidetes; DIV, multiple kingdoms; EUK, Eukaryota; FUN, fungi; MYCO, Mycobacterium; PLANT, Plantae; PROT, Proteobacteria. Definitive subfamilies defined based on the E = 10−55 threshold (column marked with bold dashed lines) are numbered in the right-most column, in ascending order according to the family size/sequence members. Subfamily mnemonics assigned based on known activities or taxonomic distribution are as follows: AGA, β-agarases; CAR, κ-carrageenase; CHI, chitin β(1,6)-glucanosyltransferase; EGA, endo-β(1,4)-galactosidases; FUN, fungal; FUR, Furcellaranase; GAL, endo-β(1,3)-galactanases; LAM, endo-β-glucanases; LIC, endo-β(1,3)/β(1,4)-glucanase; MB, Mycobacterium; POR, β-porphyranases; UNK, Unknown; XTH, Xyloglucan endo-tranglycosylase/endo-hydrolase. The bottom row show the nonclassified (nc) sequences, not assigned to any subfamily (548 of 22,946 total GH16 sequences at the 10−55 threshold).
Figure 3.
Figure 3.
Performance of GH16 hidden Markov model libraries. HMM libraries of GH16 subfamilies, generated from the SSN at each threshold (color-coded in the legend), were evaluated in their ability to assign each GH16 module to the correct subfamily delineated by the individual SSNs. The curves show the evolution of the precision and recall (see “Experimental Procedures” for definitions) with increasing SSN E-value cutoff (cf. Fig. 2 and Fig. 4), with points corresponding to variation in HMM E-value thresholds.
Figure 4.
Figure 4.
Sequence similarity networks of 22,946 GH16 sequences. A, edges represent an E-value threshold below 10−55. Metanodes represent highly similar sequences (E > 10−85); only metanodes containing 20 or more sequences are enlarged, with the number of merged sequences indicated. The network defines 23 subfamilies (see Fig. 2 for subfamily numbering and mnemonics). Clusters that lack sufficient taxonomic diversity or size to define subfamilies are indicated in white. B, edges represent an E-value threshold below 10−25. Metanodes represent defined subfamilies in A (E > 10−55); the network displays the basic relationship of subfamilies at this relaxed threshold (cf. Fig. 2).
Figure 5.
Figure 5.
Phylogenetic tree and structure–function relationships of GH16. A, maximum-likelihood phylogenetic tree was generated using up to 30 representative sequences for each GH16 subfamily defined by the sequence similarity network shown in Fig. 4. Three GH7 cellulases (GH7 and GH16 constitute clan GH-B) (7) were used to root the tree. Bootstrap values based on 100 replicates are shown. The tree separates (indicated by a line) GH16 enzymes with the β-bulge active-site motif EXDXXE from those with the β-strand active-site motif EXDXE, concordant with previous analyses (30, 51). Branch coloring is identical to that used in Figs. 2 and 4; subfamily numbering and mnemonics are given in Fig. 2. Subfamily membership of all GH16 members is available on the actively curated CAZy database (http://www.cazy.org/GH16.html).5 B, ribbon drawings of 3D structures of representative subfamily members (where present, see Table 1). Loops, structural elements and residues that are characteristic of a given subfamily are colored with their respective color (color bar underneath the structural icon), the same as in the phylogenetic tree in A.

References

    1. Varki A. (2017) Essentials of Glycobiology, 3rd Ed., Cold Spring Harbor Laboratory, Cold Spring Harbor, NY - PubMed
    1. Popper Z. A., Michel G., Hervé C., Domozych D. S., Willats W. G., Tuohy M. G., Kloareg B., and Stengel D. B. (2011) Evolution and diversity of plant cell walls: from algae to flowering plants. Annu. Rev. Plant Biol. 62, 567–590 10.1146/annurev-arplant-042110-103809 - DOI - PubMed
    1. Burton R. A., Gidley M. J., and Fincher G. B. (2010) Heterogeneity in the chemistry, structure and function of plant cell walls. Nat. Chem. Biol. 6, 724–732 10.1038/nchembio.439 - DOI - PubMed
    1. Field C. B., Behrenfeld M. J., Randerson J. T., and Falkowski P. (1998) Primary production of the biosphere: integrating terrestrial and oceanic components. Science 281, 237–240 10.1126/science.281.5374.237 - DOI - PubMed
    1. Bar-On Y. M., Phillips R., and Milo R. (2018) The biomass distribution on Earth. Proc. Natl. Acad. Sci. U.S.A. 115, 6506–6511 10.1073/pnas.1711842115 - DOI - PMC - PubMed

Publication types

MeSH terms