. 2016 Nov 15;113(46):13021-13026.
doi: 10.1073/pnas.1605685113. Epub 2016 Nov 2.

Structural and functional consequences of a disease mutation in the telomere protein TPP1

Affiliations

Structural and functional consequences of a disease mutation in the telomere protein TPP1

Kamlesh Bisht et al. Proc Natl Acad Sci U S A. .

Abstract

Telomerase replicates chromosome ends to facilitate continued cell division. Mutations that compromise telomerase function result in stem cell failure diseases, such as dyskeratosis congenita (DC). One such mutation (K170Δ), residing in the telomerase-recruitment factor TPP1, provides an excellent opportunity to structurally, biochemically, and genetically dissect the mechanism of such diseases. We show through site-directed mutagenesis and X-ray crystallography that this TPP1 disease mutation deforms the conformation of two critical amino acids of the TEL [TPP1's glutamate (E) and leucine-rich (L)] patch, the surface of TPP1 that binds telomerase. Using CRISPR-Cas9 technology, we demonstrate that introduction of this mutation in a heterozygous manner is sufficient to shorten telomeres in human cells. Our findings rule out dominant-negative effects of the mutation. Instead, these findings implicate reduced TEL patch dosage in causing telomere shortening. Our studies provide mechanistic insight into telomerase-deficiency diseases and encourage the development of gene therapies to counter such diseases.

Keywords: TEL patch; TPP1; dyskeratosis congenita; telomerase; telomere.


Conflict of interest statement

The authors declare no conflict of interest.

Figures
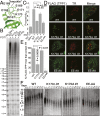
Fig. 1.
Fig. 1.
The main-chain, but not the side-chain, of TPP1 K170 is important for stimulating telomerase processivity, recruiting telomerase to telomeres, and for telomere elongation. (A) Ribbon depiction of a part of the TPP1–OB WT crystal structure (PDB ID code 2I46) with the TEL patch loop (amino acids 166–171) shown in stick representation. The protrusion in the loop is referred to here as a “knuckle.” (B) Direct primer extension assays with telomerase extracts performed in the presence of purified POT1 (500 nM) and the indicated TPP1-N proteins (500 nM). “No TPP1” indicates a reaction lacking TPP1-N and POT1. The number of hexameric (GGTTAG) telomeric repeats is indicated on the left. (C) Quantification of telomerase processivity from triplicate experiments of which B is representative. (D) FISH was used to detect TR (red) and IF was used to detect the indicated FLAG-TPP1 proteins (green). Clonal cell lines of TPP1 K170Δ and K170A were analyzed in conjunction with previously characterized clones of TPP1 WT and E169A/E171A. Yellow spots in the “Merge” panel indicate recruitment of telomerase to telomeres. (Magnification: 100×.) (E) Quantification of data of which D is representative. The average “% FLAG-TPP1 foci that contain TR” and SDs (error bars) of 10 fields of view (30–100 cells total) were plotted for the indicated stable cell lines. (F) Telomere restriction fragment (TRF) Southern blot of genomic DNA from stable cell lines expressing the indicated TPP1 constructs.
Fig. S1.
Fig. S1.
POT1-binding and telomerase stimulation analysis of TPP1 TEL patch mutants. (A) Pull down of human POT1 (amino acids 299–634) on glutathione (GSH) beads containing the indicated GST–TPP1 fusions. The asterisk (*) indicates a prominent degradation product that copurifies with TPP1-N, which is approximately equal in size to GST–TPP1–OB. (B) Coomassie-stained SDS/PAGE showing uniform purity of the indicated TPP1-N protein constructs; EE-AA indicates E169A/E171A. (C) Primer extension assay with the indicated TPP1 mutants with quantification of processivity indicated at the bottom of the gel.
Fig. S2.
Fig. S2.
HeLa cell lines stably overexpressing K170Δ and K170A proteins. (A) Immunoblot showing comparable protein levels of FLAG-TPP1 in the indicated cell lines stably overexpressing WT or mutant TPP1 proteins. (B) IF-FISH to detect TR (red) and the indicated FLAG-TPP1 proteins (green) in the indicated clonal cell lines overexpressing either TPP1 K170Δ or K170A. (Magnification: 100×.) (C) TRF Southern blot of genomic DNA from stable cell lines expressing the indicated TPP1 constructs. (D) Quantification of data shown in C and Fig. 1F after subtracting the telomere length at “day 0.” (E) Quantification of mean TRF length from data shown in C and Fig. 1F.
Fig. 2.
Fig. 2.
Deletion of K170 restructures the loop that harbors the critical glutamate residues of the TEL patch of TPP1. (A) Ribbon diagrams of TPP1-OB K170Δ (red, Left) and TPP1–OB K170A (tan, Center) along with the overlay of these structures on the structure of TPP1–OB WT (WT in green, Right). (B) Overlay of the backbone traces for amino acids 166–171 of the three structures along with the 2Fo – Fc electron density for TPP1–OB K170Δ contoured at 1.1 σ (Left); or the 2Fo – Fc electron density for TPP1–OB K170A contoured at 1.1 σ (Center); or without any electron density displayed (Right). Single arrowheads indicate the TEL patch knuckle, and the double-headed arrows indicate the displacement of E168 and E169 in TPP1–OB K170Δ relative to their positions in the WT structure. The PDB code for the previously published TPP1–OB WT structure is 2I46.
Fig. S3.
Fig. S3.
Stick representations of the TPP1–OB mutant crystal structures. Overlay of the stick representations of amino acids 166–171 of TPP1–OB K170Δ and TPP1–OB WT (Left); TPP1–OB K170A and TPP1–OB WT (Center); and all three structures (Right).
Fig. 3.
Fig. 3.
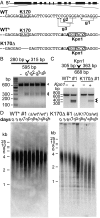
A single K170Δ allele is sufficient to cause telomere shortening in HEK 293T cells. (A) The ACD gene coding for TPP1 protein is shown with exons as boxes and introns as lines. The sequence in exon #3 flanking the K170Δ codon is shown (WT) along with the “NGG” PAM sequences (underlined) and the cut sites (arrows) for the three guide RNAs (g1, g2, and g3). The mutagenic ssODN sequences to introduce WT* and K170Δ mutations are also shown; silent mutations to introduce the KpnI site (shown in a box) and to destroy Cas9 recognition are italicized and depicted in bold. (B) Results of the PCR-based Surveyor assay for assessing the efficiency of cleavage by Cas9 are shown for the indicated guide RNAs targeting the ACD gene. “all” indicates a transfection including all three guide RNA-encoding plasmids. The bar at the top shows the predicted product sizes upon Cas9-mediated cleavage, and the arrowheads alongside the gels indicate the uncleaved and cleaved PCR products. (C) KpnI-digests for clones of WT* (clone #1) and K170Δ (clone #1). The partial digestion of the PCR product is indicative of heterozygosity of the introduced mutations. (D) TRF Southern blot of genomic DNA from the CRISPR-Cas9 derived clones of WT* (clone #1) and K170Δ (clone #1) at the indicated days in culture.
Fig. S4.
Fig. S4.
Introducing the TPP1 disease mutation in cells using CRISPR-Cas9 technology. (A) Surveyor assay to analyze potential off-targeting of the three guide RNAs. The guide RNAs and the chromosomes that harbor the off-target are indicated. (B) PCR amplicons from genomic DNA templates of HEK 293T cells transiently cotransfected with plasmids encoding Cas9 and guide RNAs 2 and 3, and indicated ssODNs, were subjected to digestion by Kpn1 enzyme. The bar indicates the DNA digest sizes expected from successful integration of the Kpn1 site into the genome. The arrowhead indicates successful mutagenesis with WT* and K170Δ ssODNs. (C) Kpn1-digests for indicated unedited and K170Δ #2 clones. (D) Representative data for chromosome 16-specific centromere FISH in HEK 293T cells. The three bright spots indicate the FISH signals, whereas the gray background indicates nuclear staining (DAPI). (Magnification: 100×.) (E) Immunoblot of endogenous TPP1 from lysates of the indicated HEK 293T clonal cell lines (Right). The identity of the TPP1 band was verified by its effective knock down in HeLa cells transfected with a previously characterized shRNA against human TPP1 (Left). (F) TRF Southern blot of genomic DNA from the indicated HEK 293T clones at the indicated days in culture.
Fig. 4.
Fig. 4.
TPP1 K170Δ protein does not compromise the ability of WT TPP1 protein to facilitate telomerase function. (A) Telomerase primer extension involving mutant mixing and titration performed in the presence of TPP1-N WT and the TPP1-N K170Δ. The filled triangles indicate 100 nM, 200 nM and 300 nM concentrations of the indicated TPP1-N construct. “–” in lanes 1 and 9 indicate no added POT1 or TPP1 proteins. Concentrations of DNA primer (1 µM) and POT1 protein (500 nM) were held constant. “Proc.” indicates processivity relative to TPP1-N WT (200 nM). (B) IF-FISH was performed on HeLa cells transfected with either myc-tagged TPP1 WT plasmid or FLAG-tagged TPP1 K170Δ plasmid or a mixture of the two. IF was performed with the anti-myc and anti-FLAG primary antibodies, and TR was detected by FISH as already described in Fig. 2. (Magnification: 100×.) Quantification performed, as in Fig. 1, is shown on the right. (C) TRF Southern blot of genomic DNA from the indicated CRISPR-Cas9 derived HEK 293T clones.
Fig. S5.
Fig. S5.
TPP1 K170Δ protein does not compromise the ability of WT TPP1 protein to facilitate telomerase recruitment to telomeres. (A) Immunoblot analysis with the indicated antibodies of cell lysates obtained from the indicated transfections. (B) Telomere ChIP experiments using anti-TERT and anti-TRF2 antibodies. The “input” sample contains 25% of the whole-cell extract. Quantification of telomere ChIP experiments done in duplicate with the SEM indicated with error bars is shown at the bottom. The “Relative telomeric DNA signal on α-TERT beads (%)” represents the ratio of the telomeric DNA signals of the TERT and TRF2 immunoprecipitations for each of the indicated transfections.
Fig. S6.
Fig. S6.
Telomere length analysis of single and double TPP1 knockout HEK 293T cells. (A) Immunoblot to detect endogenous TPP1 protein in the indicated CRISPR-Cas9 derived TPP1 knockout HEK 293T cell lines. (B) Quantification of TRF length data shown in Figs. 3D and 4C.

References

    1. Greider CW, Blackburn EH. Identification of a specific telomere terminal transferase activity in Tetrahymena extracts. Cell. 1985;43(2 Pt 1):405–413. - PubMed
    1. Meyerson M, et al. hEST2, the putative human telomerase catalytic subunit gene, is up-regulated in tumor cells and during immortalization. Cell. 1997;90(4):785–795. - PubMed
    1. Lingner J, et al. Reverse transcriptase motifs in the catalytic subunit of telomerase. Science. 1997;276(5312):561–567. - PubMed
    1. Shay JW, Wright WE. Telomeres and telomerase in normal and cancer stem cells. FEBS Lett. 2010;584(17):3819–3825. - PMC - PubMed
    1. Savage SA. Human telomeres and telomere biology disorders. Prog Mol Biol Transl Sci. 2014;125:41–66. - PubMed

Publication types