. 2019 Mar 29;294(13):4759-4774.
doi: 10.1074/jbc.RA118.006173. Epub 2019 Feb 5.

Structural architecture of a dimeric class C GPCR based on co-trafficking of sweet taste receptor subunits

Affiliations

Structural architecture of a dimeric class C GPCR based on co-trafficking of sweet taste receptor subunits

Jihye Park et al. J Biol Chem. .

Abstract

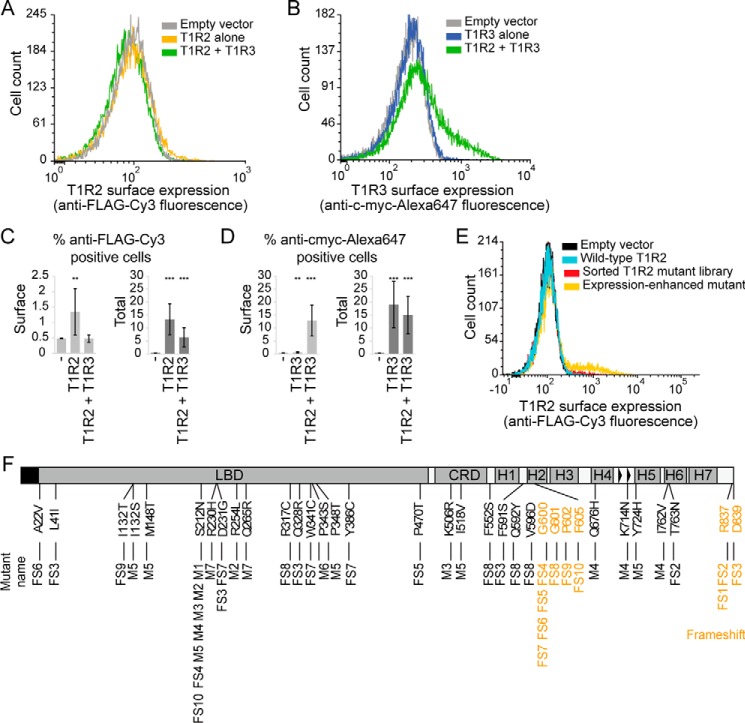
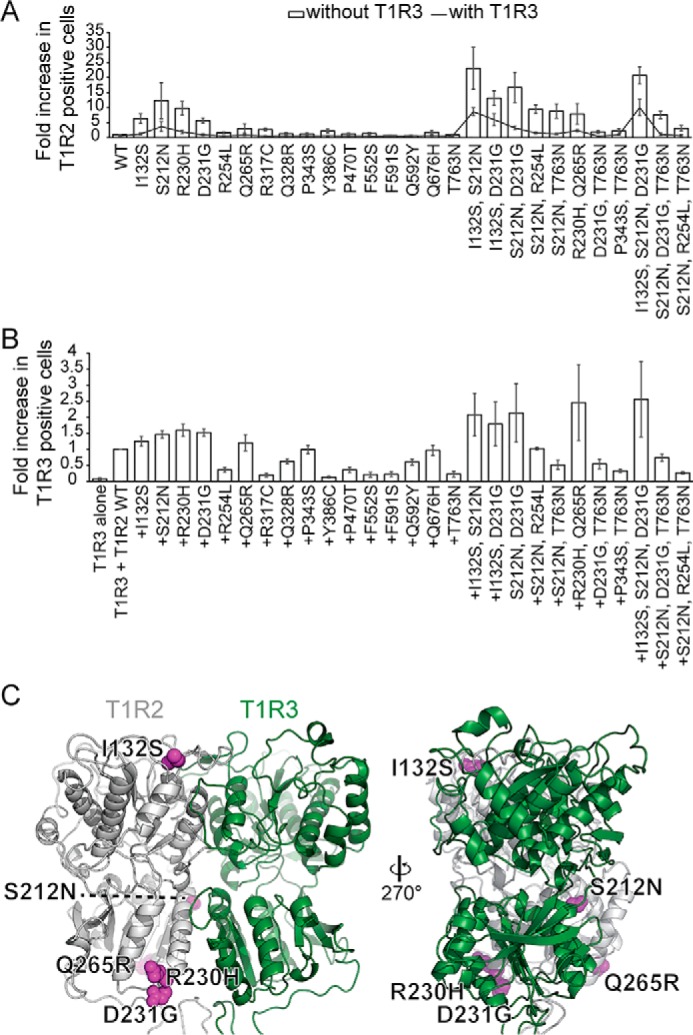
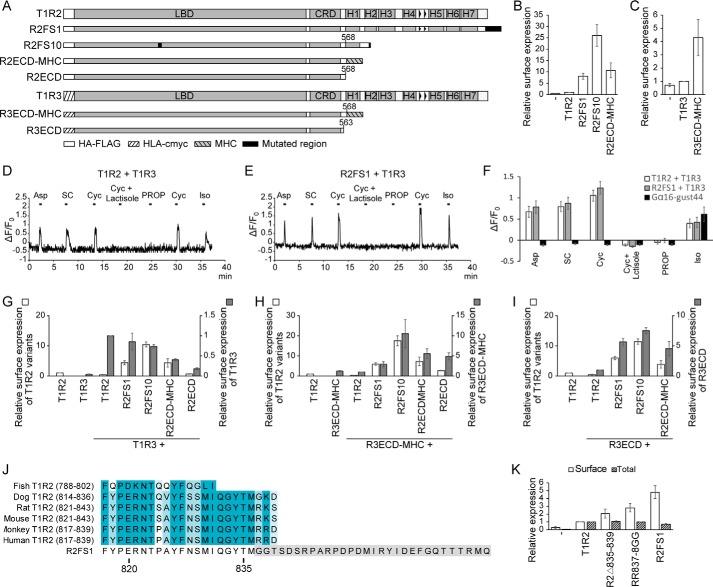
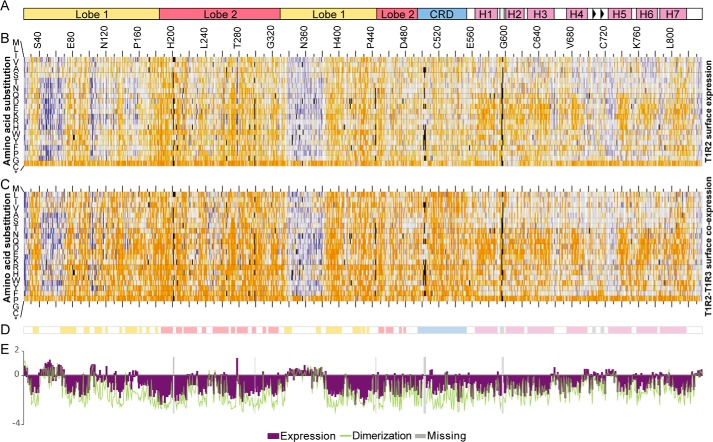
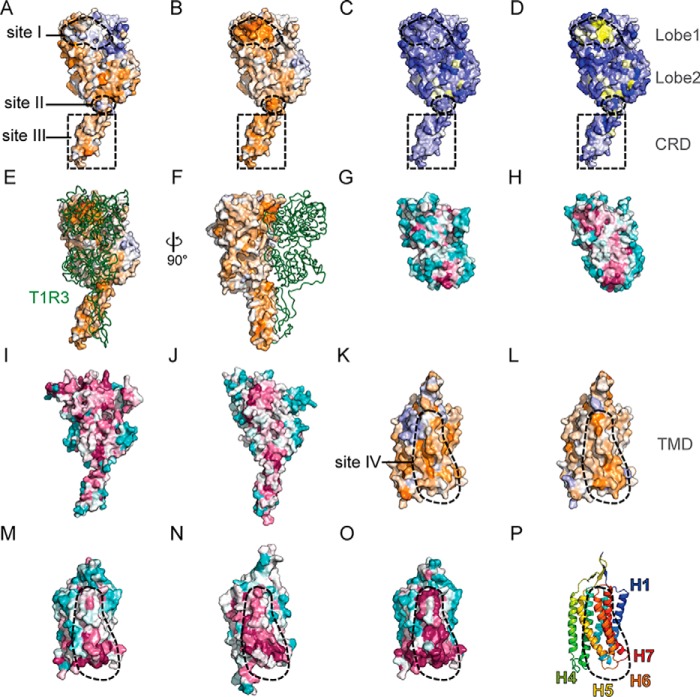
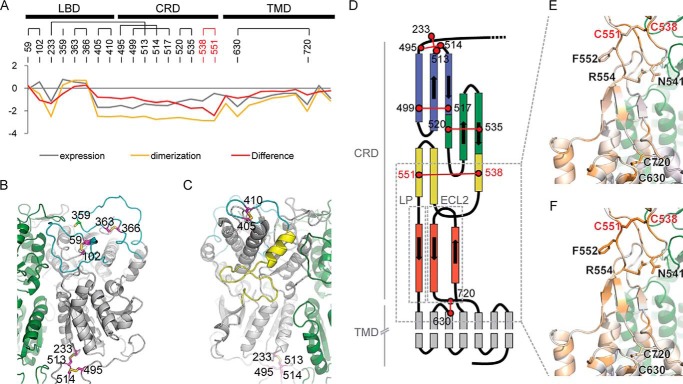
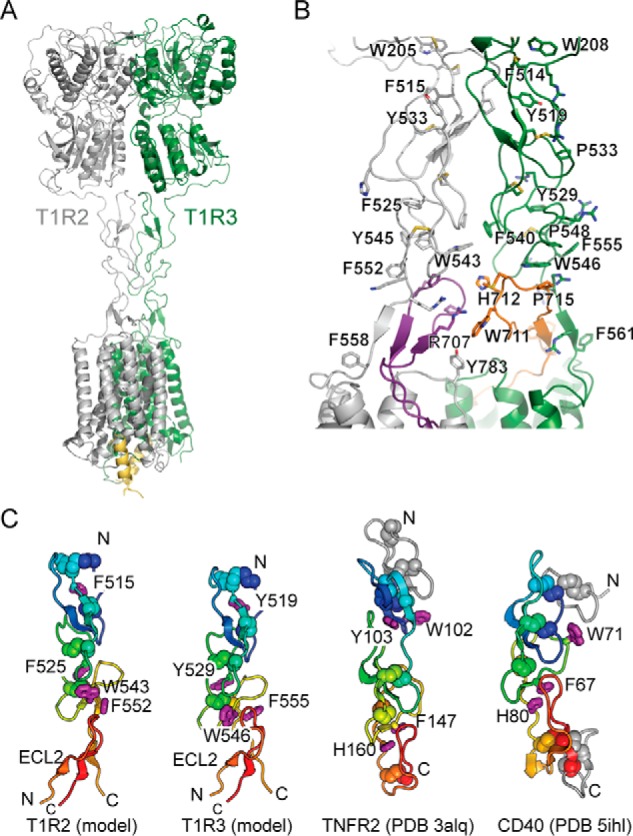
Class C G protein-coupled receptors (GPCRs) are obligatory dimers that are particularly important for neuronal responses to endogenous and environmental stimuli. Ligand recognition through large extracellular domains leads to the reorganization of transmembrane regions to activate G protein signaling. Although structures of individual domains are known, the complete architecture of a class C GPCR and the mechanism of interdomain coupling during receptor activation are unclear. By screening a mutagenesis library of the human class C sweet taste receptor subunit T1R2, we enhanced surface expression and identified a dibasic intracellular retention motif that modulates surface expression and co-trafficking with its heterodimeric partner T1R3. Using a highly expressed T1R2 variant, dimerization sites along the entire subunit within all the structural domains were identified by a comprehensive mutational scan for co-trafficking with T1R3 in human cells. The data further reveal that the C terminus of the extracellular cysteine-rich domain needs to be properly folded for T1R3 dimerization and co-trafficking, but not for surface expression of T1R2 alone. These results guided the modeling of the T1R2-T1R3 dimer in living cells, which predicts a twisted arrangement of domains around the central axis, and a continuous folded structure between transmembrane domain loops and the cysteine-rich domains. These insights have implications for how conformational changes between domains are coupled within class C GPCRs.

Keywords: G protein-coupled receptor (GPCR); deep mutational scan; dimerization; directed evolution; membrane trafficking; molecular modeling; mutagenesis; structural model.


Conflict of interest statement

The authors declare that they have no conflicts of interest with the contents of this article

Figures

Figure 1.
Figure 1.
Selection of T1R2 mutants with increased surface expression. A and B, flow cytometry histograms representing surface expression of FLAG–T1R2 (A) and c-Myc–T1R3 (B) transfected in Expi293F cells. C and D, quantified flow cytometry data showing surface and total expression of FLAG–T1R2 (C) and c-Myc–T1R3 (D). Gates for T1R2 (anti-FLAG–Cy3)- or T1R3 (anti-c-Myc–Alexa 647)-positive cells were set at 0.5% of negative control cells. The percent positive cells in the transfected culture was a more reproducible indicator of expression than measuring mean fluorescence of a very small positive population. Data are averaged over at least 12 experiments (± S.D.). **, p < 0.01; ***, p < 0.001; Student's two-tailed unpaired t test. E, flow cytometry histogram showing the emergence of T1R2 mutants with enhanced surface expression after two rounds of FACS enrichment. F, sites of mutations found in 17 T1R2 variants with enhanced expression. Amino acid substitutions are black. Frameshift mutations are orange.
Figure 2.
Figure 2.
Surface expression and co-trafficking with T1R3. A, quantified flow cytometry data of T1R2 surface expression by itself (columns) or co-transfected with T1R3 (unbroken black line). The gate for T1R2 (anti-FLAG–Cy3)-positive cells was set at 0.5% of vector-only control cells. Data are mean ± S.D., n ≥ 3. B, Expi293F cells were co-transfected with WT T1R3 and the indicated T1R2 mutants. Surface expression of T1R3 was quantified by flow cytometry. The gate for T1R3 (anti-c-Myc–Alexa 647)-positive cells was set at 0.5% of control cells. Values are normalized to the percentage of T1R3-positive cells in the sample co-transfected with WT T1R2 and T1R3. Data are mean ± S.D., n ≥ 3. C, homology model of the human T1R2 (gray) and T1R3 (green) dimer showing the positions of five T1R2 substitutions (magenta spheres) that enhanced surface expression of both subunits.
Figure 3.
Figure 3.
Effects of ECD and TMD interactions on surface expression of T1R2–T1R3. A, schematic diagram of T1R2 and T1R3 constructs. Quantified flow cytometry data of surface expression of FLAG–T1R2 (B) and c-Myc–T1R3 constructs (C) were expressed individually. Gates for positive cells were set at 0.5% of control cells. The percentage of positive cells was normalized to the percent positive cells expressing WT T1R2 or T1R3. Mean ± S.D., n = 3. D and E, representative recordings of Ca2+ mobilization in single cells. HEK293 cells heterologously expressing T1R2 + T1R3 (D) or R2FS1 + T1R3 (E) with Gα16–gust44 showed Ca2+ responses to non-nutritive sweeteners 10 mm Asp, 0.3 mm SC, and 30 mm Cyc, but not to Cyc with lactisole (1 mm) (T1R3 inhibitor) or 1 mm PROP (T2R38 agonist). Positive control: 10 μm Iso. F, HEK293 cells were transiently transfected with T1R2 or R2FS1 along with T1R3 and Gα16-gust44 or Gα16-gust44 without sweet taste receptor. The responses to aspartame, SC, Cyc, Cyc with lactisole, PROP, and Iso were measured. Data are mean ± S.E., 27–29 cells (n = 3). G–I, normalized percent positive cells after analyzing surface expression of FLAG–T1R2 constructs co-expressed with WT T1R3 (G), R3ECD–MHC (H), and R3ECD (I). Mean ± S.D., n = 3. J, sequence alignment of C-terminal cytosolic tails from fish, dog, rat, mouse, monkey, and human T1R2 with frameshift mutant R2FS1. K, quantified flow cytometry data of surface (white) and total (gray) expression of T1R2 constructs. Percent positive cells is normalized to the percentage of cells expressing WT T1R2. Data are mean ± S.D. over at least three experiments.
Figure 4.
Figure 4.
Sequence–activity landscapes of human T1R2 for surface expression and co-trafficking with T1R3. A, schematic diagram showing domain organization of T1R2 primary sequence. B, sequence–activity landscape of T1R2 based on selection for surface expression. Amino acid substitutions are plotted vertically, whereas the T1R2 sequence is scanned on the horizontal axis. Log2 enrichment ratios (average from two independent replicates) are plotted from ≤ −3 (depleted, orange) to 0 (neutral, white) to ≥ +3 (enriched, blue). Mutations missing in the naïve libraries (frequencies less than 5 × 10⁻⁶) are black. *, stop codon. C, sequence–activity landscape of T1R2 based on selection of cells co-expressing both T1R2 and T1R3. Data are plotted and colored as described for B. D, schematic diagram showing regions with secondary structure (colored by domain, as in A) based on crystal structures of homologs. E, plot of average conservation scores along the T1R2 sequence. The more negative the score, the more conserved the residue in the in vitro selection experiment for T1R2 surface expression (purple bars) or T1R2–T1R3 surface co-expression (green line). Positions where substitutions were missing in the naïve SSM libraries are shaded gray.
Figure 5.
Figure 5.
Important sites on T1R2 for surface expression and heterodimerization. A, surface representation of a homology model of T1R2 ECD, colored by conservation scores following in vitro selection for T1R2 surface expression. Proposed dimerization sites on the ECD are shown with dashed lines. Conservation scores are colored from ≤ −2 (conserved, orange) to 0 (variable, white) to ≥ +2 (under selection for change, blue). B, surface representation of T1R2 ECD showing the different conservation scores between in vitro selections for surface expression of T1R2 alone and T1R2–T1R3 together. Difference conservation scores are colored from ≤ −2 (preferentially conserved for dimerization, orange) to 0 (equally conserved in both selections, white) to ≥ +2 (preferentially conserved for T1R2 surface expression alone, blue). C, surface of T1R2 ECD colored by the average of the hydropathy-weighted log2 enrichment ratios after selection for T1R2 surface expression. Residues that prefer polar substitutions are blue, and the residues that prefer hydrophobic amino acids are yellow. D, surface of T1R2 ECD colored by hydropathy scores (residues tolerant of polar substitutions are blue; residues that prefer hydrophobic amino acids are yellow) from the in vitro selections for T1R2–T1R3 surface co-expression. E and F, model of T1R2 ECD (surface, colored by difference conservation score as in B) bound to T1R3 ECD (green ribbon). E is in the same orientation as in A–D. G–J, conservation during natural evolution (based on ortholog sequence alignments) is shown on the crystal structures of fish T1R2 LBD (G; PDB 5X2N), fish T1R3 LBD (H; PDB 5X2N), CaSR ECD (I; PDB 5K5S), and mGluR3 ECD (J; PDB 2E4W). Variable residues are in turquoise, and the highly conserved residues are in maroon. All structures are aligned and in the same conformation as A–D. K, model of T1R2 TMD showing average conservation scores based on in vitro selection for surface expression. Site IV is shown with a dashed line. Conservation scores are colored from ≤ −1.5 (conserved, orange) to 0 (variable, white) to ≥ +1.5 (under selection for change, blue). L, difference conservation scores (as in B) are mapped to the surface of a model of T1R2 TMD. Residues more conserved for T1R2–T1R3 co-trafficking are orange (scores ≤ −1.5); residues similarly conserved under both selection regimes are white; and residues preferentially conserved for T1R2 surface expression are blue (scores ≥ +1.5). M–O, sequence conservation during natural evolution mapped to surfaces of the homology model of T1R2 TMD (M), T1R3 TMD (N), and mGluR1 TMD (O; PDB 4OR2). Evolutionarily conserved residues are shown in maroon to the highly variable residues shown in turquoise. Structures are oriented as in K and L, with site IV encircled by a dashed line. P, cartoon representation of L with the T1R2 TMD colored as a spectrum from the N terminus (blue) to the C (red) terminus.
Figure 6.
Figure 6.
Mutational tolerance of T1R2 cysteine residues. A, plot showing average conservation scores of all cysteine residues following in vitro selection. Negative scores indicate greater conservation and intolerance to mutations. Cysteine residues that are preferentially highly conserved for T1R2–T1R3 co-trafficking are highlighted by the difference score and are colored red. B and C, cartoon representations (views are rotated by 180°) showing the positions of cysteine residues in a model of the ECD. T1R2 is gray, and T1R3 is green. Loops containing cysteines (magenta sticks) are colored cyan, and the C-terminal end of lobe 1 is colored yellow. Cys359, which forms a disulfide to T1R3, is light green. D, topology of the CRD and TMD showing disulfides (red lines) between cysteine residues (red circles). Highly conserved cysteines based on the difference conservation score are in bold red text. One A1′ module and two A1 modules are colored blue, green, and yellow, respectively, and one A1-like module is colored red. LP, linker peptide. E and F, cartoon representations showing close-up view of the boxed region in D. Cysteines and highly conserved residues in the CRD for T1R2–T1R3 co-expression are shown with sticks. Expression (E) and difference (F) conservation scores are mapped to T1R2; conservation scores are colored from ≤ −2 (conserved, orange) to ≥ +2 (blue).
Figure 7.
Figure 7.
Model of the human sweet taste receptor. A, model of the full-length T1R2–T1R3 heterodimer. C-terminal 18-residue peptides of G proteins are shown in yellow and were included in the model to maintain the TMDs in active conformations during minimization. B, model of the dimerization interface between the CRDs of T1R2 (gray) and T1R3 (green). Cysteines and other key residues involved in stacking interactions are shown as sticks. ECL2 of T1R2 and T1R3 are purple and orange, respectively. C, comparison of CRD structures from the T1R2–T1R3 model to TNFR2 (46) and CD40 (47). Cysteines are shown as spheres, and key aromatic residues that mediate module stacking are shown as purple sticks. A shared structural fold is colored from the N terminus in blue to the C terminus in red, with additional structural elements in gray.

References

    1. Nelson G., Hoon M. A., Chandrashekar J., Zhang Y., Ryba N. J., and Zuker C. S. (2001) Mammalian sweet taste receptors. Cell 106, 381–390 10.1016/S0092-8674(01)00451-2 - DOI - PubMed
    1. Li X., Staszewski L., Xu H., Durick K., Zoller M., and Adler E. (2002) Human receptors for sweet and umami taste. Proc. Natl. Acad. Sci. U.S.A. 99, 4692–4696 10.1073/pnas.072090199 - DOI - PMC - PubMed
    1. Jiang P., Cui M., Zhao B., Liu Z., Snyder L. A., Benard L. M., Osman R., Margolskee R. F., and Max M. (2005) Lactisole interacts with the transmembrane domains of human T1R3 to inhibit sweet taste. J. Biol. Chem. 280, 15238–15246 10.1074/jbc.M414287200 - DOI - PubMed
    1. Koizumi A., Nakajima K., Asakura T., Morita Y., Ito K., Shmizu-Ibuka A., Misaka T., and Abe K. (2007) Taste-modifying sweet protein, neoculin, is received at human T1R3 amino-terminal domain. Biochem. Biophys. Res. Commun. 358, 585–589 10.1016/j.bbrc.2007.04.171 - DOI - PubMed
    1. Shi P., and Zhang J. (2006) Contrasting modes of evolution between vertebrate sweet/umami receptor genes and bitter receptor genes. Mol. Biol. Evol. 23, 292–300 10.1093/molbev/msj028 - DOI - PubMed

Publication types

MeSH terms