. 2016 Oct 7;291(41):21553-21562.
doi: 10.1074/jbc.M116.745315. Epub 2016 Aug 24.

The Structure of the Antibiotic Deactivating, N-hydroxylating Rifampicin Monooxygenase

Affiliations

The Structure of the Antibiotic Deactivating, N-hydroxylating Rifampicin Monooxygenase

Li-Kai Liu et al. J Biol Chem. .

Abstract

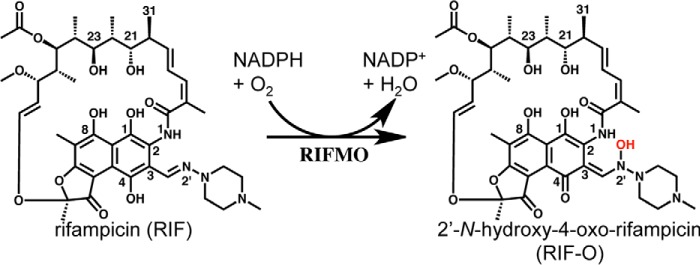
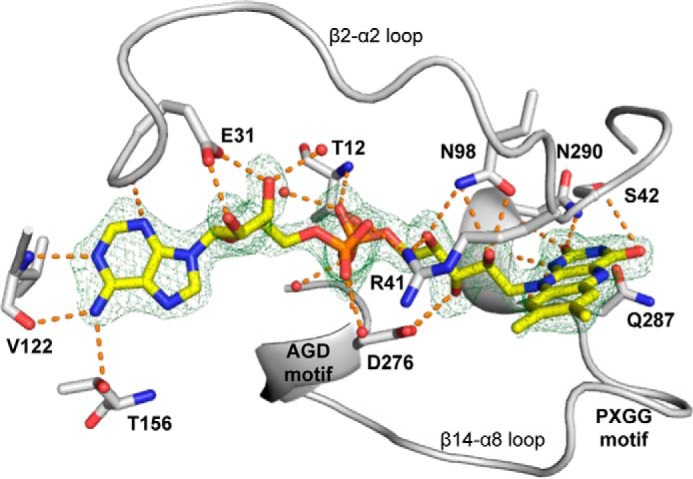
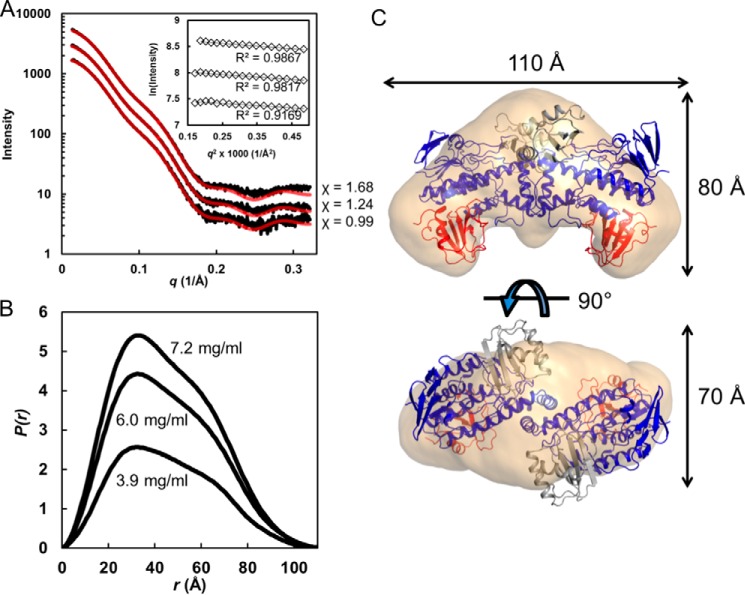
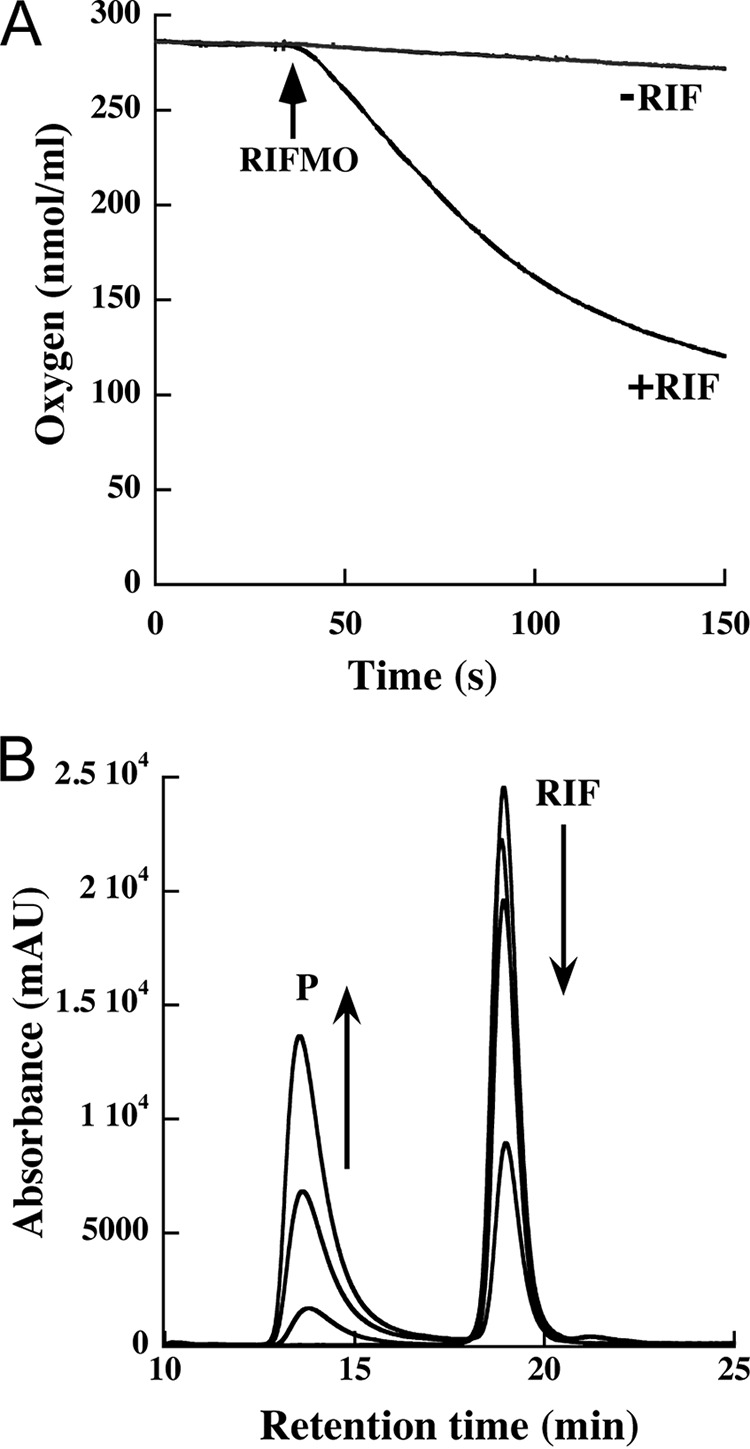
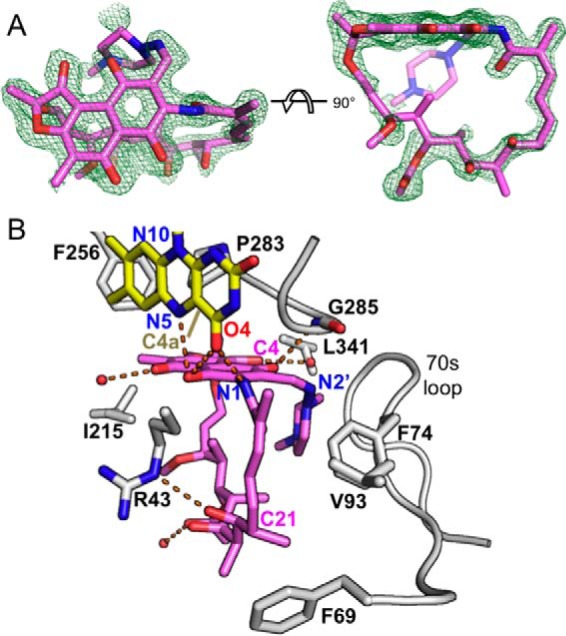
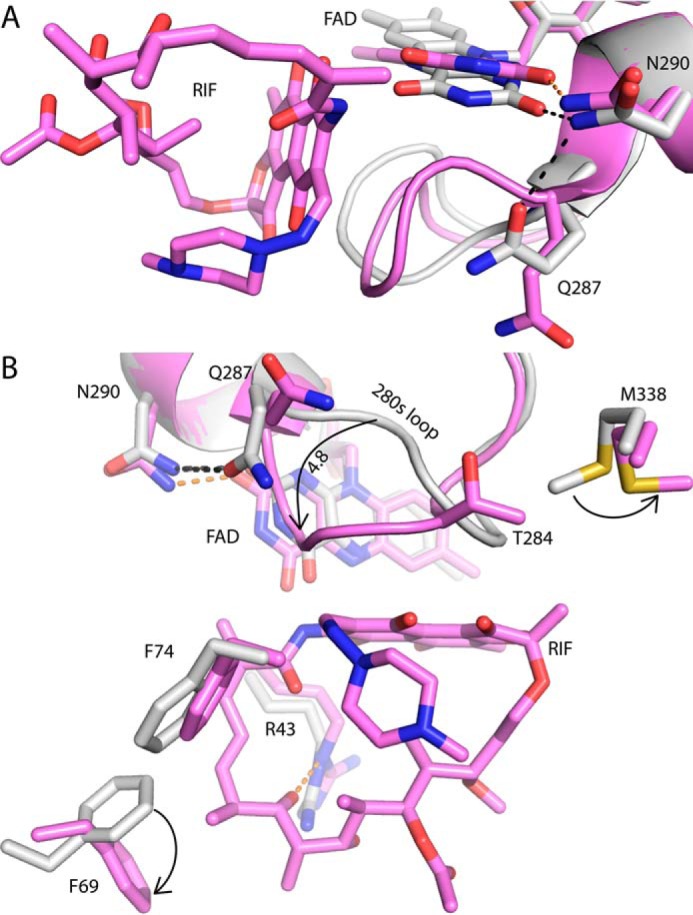
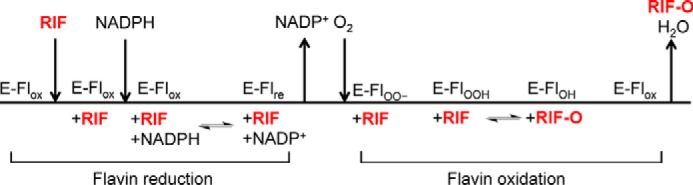
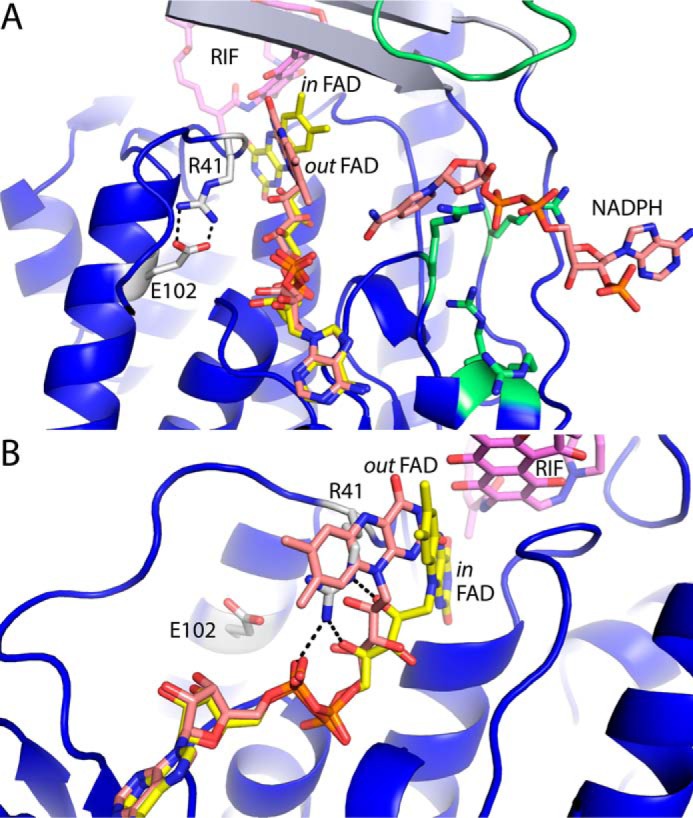
Rifampicin monooxygenase (RIFMO) catalyzes the N-hydroxylation of the natural product antibiotic rifampicin (RIF) to 2'-N-hydroxy-4-oxo-rifampicin, a metabolite with much lower antimicrobial activity. RIFMO shares moderate sequence similarity with well characterized flavoprotein monooxygenases, but the protein has not been isolated and characterized at the molecular level. Herein, we report crystal structures of RIFMO from Nocardia farcinica, the determination of the oligomeric state in solution with small angle x-ray scattering, and the spectrophotometric characterization of substrate binding. The structure identifies RIFMO as a class A flavoprotein monooxygenase and is similar in fold and quaternary structure to MtmOIV and OxyS, which are enzymes in the mithramycin and oxytetracycline biosynthetic pathways, respectively. RIFMO is distinguished from other class A flavoprotein monooxygenases by its unique middle domain, which is involved in binding RIF. Small angle x-ray scattering analysis shows that RIFMO dimerizes via the FAD-binding domain to form a bell-shaped homodimer in solution with a maximal dimension of 110 Å. RIF binding was monitored using absorbance at 525 nm to determine a dissociation constant of 13 μm Steady-state oxygen consumption assays show that NADPH efficiently reduces the FAD only when RIF is present, implying that RIF binds before NADPH in the catalytic scheme. The 1.8 Å resolution structure of RIFMO complexed with RIF represents the precatalytic conformation that occurs before formation of the ternary E-RIF-NADPH complex. The RIF naphthoquinone blocks access to the FAD N5 atom, implying that large conformational changes are required for NADPH to reduce the FAD. A model for these conformational changes is proposed.

Keywords: enzyme kinetics; enzyme structure; flavoprotein; small-angle X-ray scattering (SAXS); x-ray crystallography.


Figures

FIGURE 1.
FIGURE 1.
The reaction catalyzed by RIFMO.
FIGURE 2.
FIGURE 2.
UV-visible spectra and RIF binding data. A, UV-visible spectra of RIFMO-bound FAD (black), free FAD (blue), and RIFMO (30 μm) in the presence of 15 μm RIF (orange). B, UV-visible spectrum of 15 μm RIF (in 100 mm sodium phosphate buffer, pH 7.5) showing peak maxima at 236, 254, 334, and 475 nm. C, flavin spectra monitored as a function of increasing concentration of RIF (0–30 μm). The inset shows spectral differences after subtracting the spectrum of RIFMO with 0 μm RIF. D, determination of the KD value of RIF. The absorbance at 525 nm was plotted as a function of RIF concentration to determine a KD value of 13 ± 2 μm.
FIGURE 3.
FIGURE 3.
Crystal structure of RIFMO. A, schematic diagram with the FAD-binding domain in blue, middle domain in gray, and C-terminal domain in red. FAD is shown in yellow sticks. RIF is colored pink. B, a view into the RIF pocket. C, a view into the active site opening on the opposite side of the FAD from RIF. Arg41 is noted in green. As described under “Results,” Arg41 interacts with the FAD pyrophosphate and ribityl chain (Fig. 4) and is proposed to change conformation during the catalytic cycle (Fig. 9).
FIGURE 4.
FIGURE 4.
FAD-binding site of apo-RIFMO. FAD is colored in yellow, and the hydrogen bonds are in orange. The cage represents a simulated annealing FOFC map contoured at 3.0σ.
FIGURE 5.
FIGURE 5.
SAXS analysis. A, SAXS curves from three RIFMO samples at different concentrations (from the top: 7.2, 6.0, and 3.9 mg/ml). Black curves, experimental data. The highest concentration curve has been offset for clarity. The red curves are theoretical SAXS profiles calculated from the crystallographic homodimer with FoXS (23). Goodness of fit values (χ) are listed on the right. The inset shows Guinier plots. B, distance distribution functions, P(r). C, shape reconstruction calculated with assumed 2-fold symmetry.
FIGURE 6.
FIGURE 6.
Steady-state kinetics and HPLC analysis of RIF oxidation. A, oxygen consumption monitored with 0.5 mm NADPH in the absence (rate = 0.13 ± 0.01 s−1) and presence of 50 μm RIF substrate (rate = 2.3 ± 0.2 s−1). The arrow indicates the reaction initiation by the addition of 1 μm RIFMO. The oxygen consumption assays were done in a 1-ml mixture of 100 mm sodium phosphate, pH 7.5, at 25 °C. The rates were obtained from the slope of the initial linear portions of the curves, just after the addition of RIFMO. B, production of hydroxylated RIF by RIFMO. An HPLC chromatogram (340 nm) shows the elution of RIF and hydroxylated RIF (P). The arrows show the RIF peak decreasing and the P peak increasing at 0, 10, 30, and 60 s. mAU, milliabsorbance units.
FIGURE 7.
FIGURE 7.
Electron density and interactions for RIF bound to RIFMO. A, two views of the electron density for RIF. The cage represents a simulated annealing FOFC map contoured at 3.0 σ. Note that the methylpiperazine atoms have been deleted in the deposited PDB file to reflect the lack of observable electron density. B, interactions between RIF and RIFMO. The residues involved with interactions are in white. RIF (pink), FAD (yellow), and residues contacting RIF are shown as sticks. Water molecules are shown as red spheres, and hydrogen bonds are colored as orange dashed lines.
FIGURE 8.
FIGURE 8.
Superposition of apo-RIFMO (white) and the RIFMO-RIF complex (pink). A, close-up view emphasizing the rotation of the FAD and rupture of the Asn290–Gln287 hydrogen bond. B, a view emphasizing conformational changes in the 280s loop and side chain rotations. The arrows indicate the direction of conformational changes associated with RIF binding.
SCHEME 1.
SCHEME 1.
Proposed catalytic scheme for RIFMO. The left-hand side of the scheme depicts the steps involved in the binding of RIF and the reduction of the FAD by NADPH (reductive half-reaction). The right-hand side shows the steps involved in the hydroxylation of RIF and regeneration of the oxidized FAD (oxidative half-reaction). Downward arrows denote substrate binding, and upward arrows denote product dissociation. For each step, the redox state of the FAD is listed above the horizontal line. Enzyme-bound substrates and products are indicated below the horizontal line. E-Flox, RIFMO with oxidized FAD; E-Flre, RIFMO with reduced FAD; E-FlOO(H), RIFMO C4a-hydroperoxyflavin intermediates; E-FlOH, RIFMO C4a-hydroxyflavin. Adapted from Ref. .
FIGURE 9.
FIGURE 9.
A model for conformational changes in RIFMO. A, a model of RIFMO with the FAD in the out conformation and NADPH bound. The out FAD conformation (salmon) was obtained by docking the FAD from RdmE (PDB code 3IHG (27)) onto RIFMO. The conformation of Arg41 and the ion pair with Glu102 are also modeled after RdmE. The in conformation FAD of RIFMO is shown in yellow. The coordinates of NADPH were obtained from a model of MtmOIV (21). Arg residues and a loop in RIFMO that have been shown to be important for NADPH binding in MtmOIV are colored green. B, steric clash between the out conformation FAD and Arg41 as it appears in the RIFMO structures. Black dashes represent hydrogen bonds formed by Arg41 in the RIFMO-RIF complex. The clash necessitates a conformational change in Arg41 when the FAD swings to the out conformation.

References

    1. Aristoff P. A., Garcia G. A., Kirchhoff P. D., and Hollis Showalter H. D. (2010) Rifamycins: obstacles and opportunities. Tuberculosis 90, 94–118 - PubMed
    1. Goldstein B. P. (2014) Resistance to rifampicin: a review. J. Antibiot. 67, 625–630 - PubMed
    1. Severinov K., Soushko M., Goldfarb A., and Nikiforov V. (1993) Rifampicin region revisited: new rifampicin-resistant and streptolydigin-resistant mutants in the β subunit of Escherichia coli RNA polymerase. J. Biol. Chem. 268, 14820–14825 - PubMed
    1. Telenti A., Imboden P., Marchesi F., Matter L., Schopfer K., Bodmer T., Lowrie D., Colston M. J., and Cole S. (1993) Detection of rifampicin-resistance mutations in Mycobacterium tuberculosis. Lancet 341, 647–650 - PubMed
    1. Tupin A., Gualtieri M., Roquet-Banères F., Morichaud Z., Brodolin K., and Leonetti J.-P.(2010) Resistance to rifampicin: at the crossroads between ecological, genomic and medical concerns. Int. J. Antimicrob. Agents 35, 519–523 - PubMed

MeSH terms