. 2017 Apr 7;292(14):5871-5883.
doi: 10.1074/jbc.M116.761809. Epub 2017 Feb 21.

Structural and biochemical analysis of Escherichia coli ObgE, a central regulator of bacterial persistence

Affiliations

Structural and biochemical analysis of Escherichia coli ObgE, a central regulator of bacterial persistence

Sotirios Gkekas et al. J Biol Chem. .

Abstract

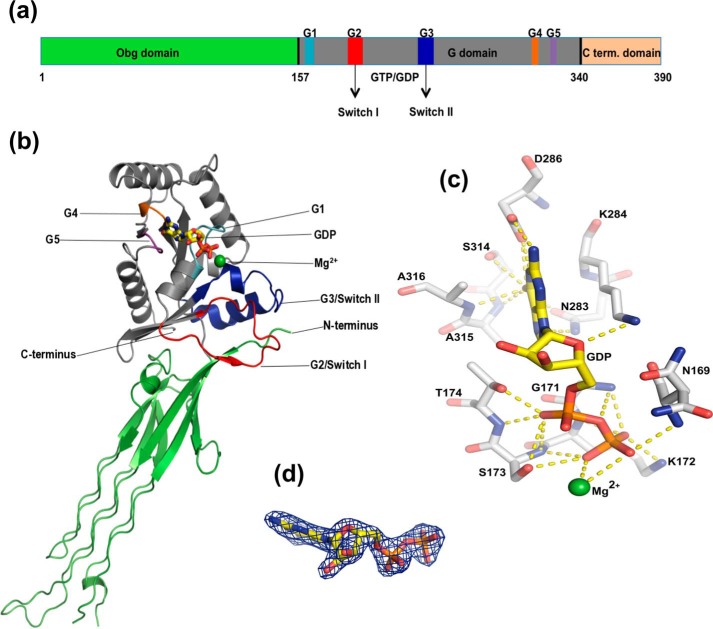
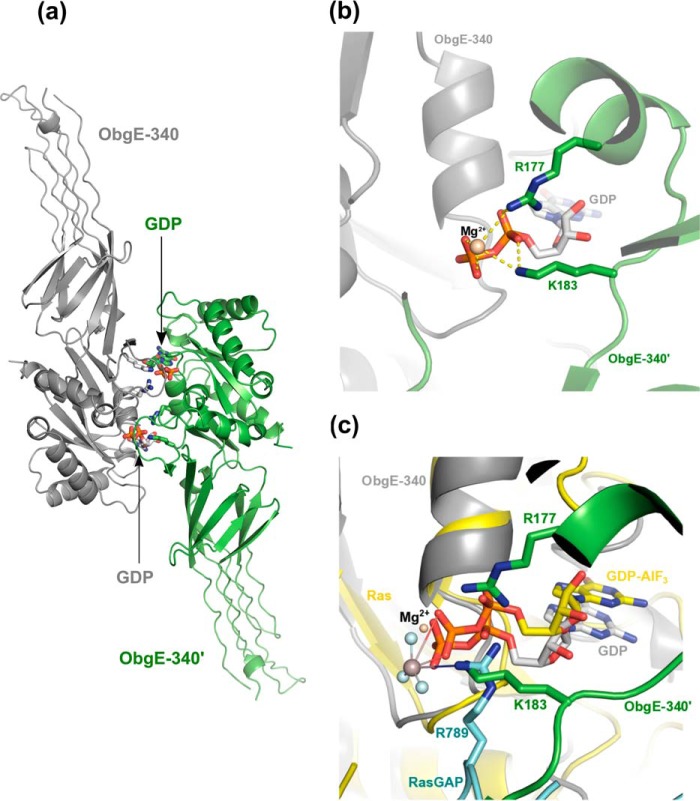
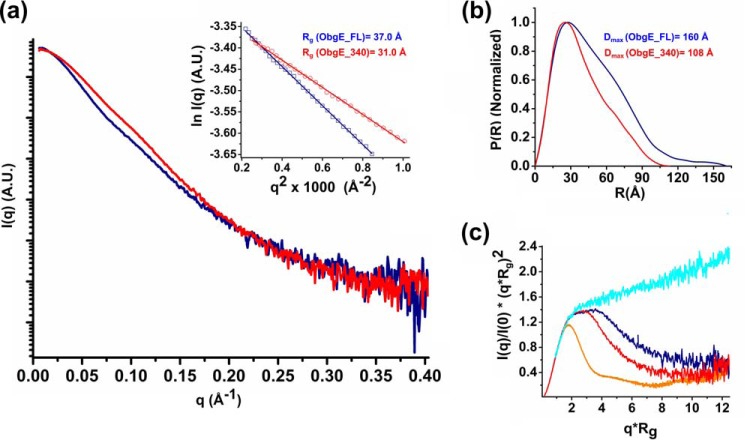
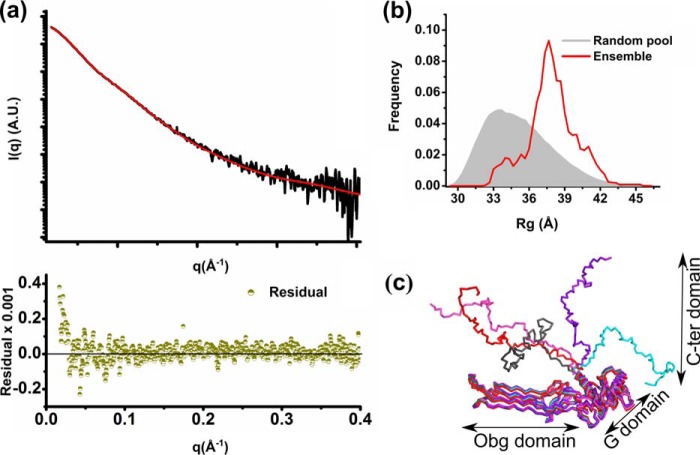
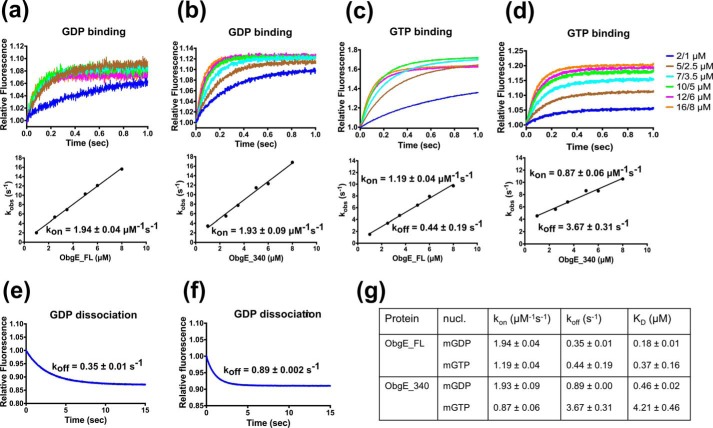
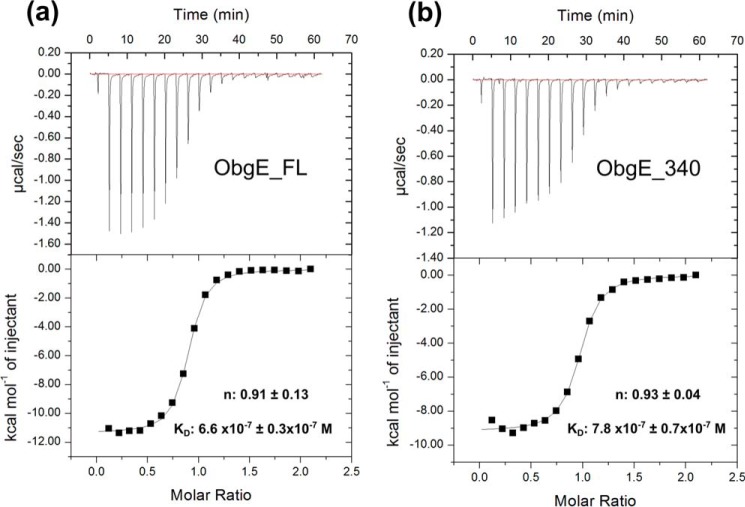
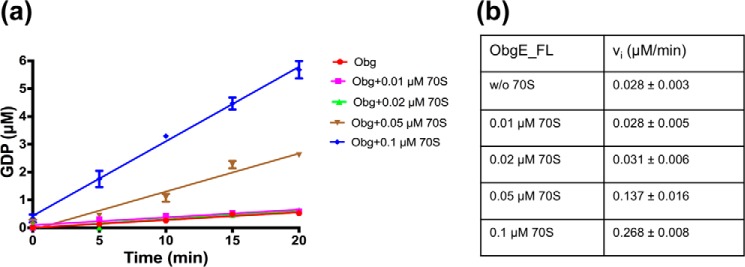
The Obg protein family belongs to the TRAFAC (translation factor) class of P-loop GTPases and is conserved from bacteria to eukaryotes. Essential roles in many different cellular processes have been suggested for the Obg protein from Escherichia coli (ObgE), and we recently showed that it is a central regulator of bacterial persistence. Here, we report the first crystal structure of ObgE at 1.85-Å resolution in the GDP-bound state, showing the characteristic N-terminal domain and a central G domain that are common to all Obg proteins. ObgE also contains an intrinsically disordered C-terminal domain, and we show here that this domain specifically contributed to GTP binding, whereas it did not influence GDP binding or GTP hydrolysis. Biophysical analysis, using small angle X-ray scattering and multi-angle light scattering experiments, revealed that ObgE is a monomer in solution, regardless of the bound nucleotide. In contrast to recent suggestions, our biochemical analyses further indicate that ObgE is neither activated by K+ ions nor by homodimerization. However, the ObgE GTPase activity was stimulated upon binding to the ribosome, confirming the ribosome-dependent GTPase activity of the Obg family. Combined, our data represent an important step toward further unraveling the detailed molecular mechanism of ObgE, which might pave the way to further studies into how this GTPase regulates bacterial physiology, including persistence.

Keywords: GTPase; X-ray crystallography; X-ray scattering; biophysics; crystal structure; enzyme kinetics; enzyme structure.


Conflict of interest statement

The authors declare that they have no conflicts of interest with the contents of this article

Figures

Figure 1.
Figure 1.
The crystal structure of E. coli ObgE_340 bound to GDP. a, domain organization of ObgE, showing the Obg domain (green), G domain (gray), and C-terminal domain (orange) and the conserved sequence motifs in the G domain (G1–G5, Switch I and II). The structure of a construct lacking the C-terminal domain (ObgE_340) was solved. b, schematic representation of the ObgE_340-GDP crystal structure. The Obg domain and G domain are shown in green and gray, respectively, with sequence motifs colored in the same way as in a. GDP is shown as sticks with carbon bonds colored yellow. Mg2+ is shown as a green sphere. c, close-up view of the GDP binding site of ObgE_340. GDP and Mg2+ are colored as in b. Hydrogen bonds between the protein and the nucleotide are indicated by yellow dotted lines. d, GDP bound to ObgE_340 with the clearly defined “omit” electron density map, contoured at 2σ, shown as a blue mesh.
Figure 2.
Figure 2.
Potential dimer interface of ObgE_340 generated though crystal symmetry operations. a, potential dimer organization of ObgE_340 via a face-to-face interaction of its G domain with the G domain of a neighboring protein molecule in the crystal lattice. The two symmetry variants are colored gray and green, and are labeled ObgE_340 and ObgE_340′, respectively. The C-atoms of the bound GDP molecules are colored according to the protomer to which they belong. b, close up view of the interaction surface shown in a. Lys-183 and Arg-177, located on the switch I and the first α-helix of the G domain of one protomer, interact with the phosphate groups of GDP from the adjacent promoter. c, superposition of the structure of the Ras-RasGAP complex (in presence of GDP-AlF3, PDB code 1WQ1 (62)) with the ObgE_340-GDP structure. The two symmetry related protomers of ObgE_340 and GDP are colored and labeled according to b. Ras and the bound GDP-AlF3 are colored yellow. The arginine finger of RasGAP (R789) is shown in cyan. This superposition shows a spatially similar position of the amino group of Lys-183 in the ObgE_340-ObgE_340′ homodimer and the guanido group of Arg-789 of RasGAP in the Ras-RasGAP complex.
Figure 3.
Figure 3.
SAXS analysis of ObgE_FL and ObgE_340 in their nucleotide-free state, providing information regarding the Rg, maximum particle dimension (Dmax), and molecular mass. a, averaged scattering profile of ObgE_340 (red) and ObgE_FL (blue). The inset shows the linear Guinier region for both constructs, indicative of a non-aggregated protein sample. The deduced Rg values are given. b, normalized P(R) profile of ObgE_340 (red) and ObgE_FL (blue). The broader distribution of intramolecular distances and larger value of Dmax of ObgE_FL reflect the disordered nature of its C-terminal domain. c, dimensionless Kratky plot for ObgE_340 (red) and ObgE_FL (blue) in comparison with an intrinsically disordered protein (hTau40wt, cyan trace) and a globular protein (BSA, orange trace) (68). Although the shapes of both curves are typical for an elongated protein such as ObgE, comparison of the curves indicates a higher degree of flexibility in ObgE_FL. Raw data underlying the averaged scattering profiles are shown in supplemental Figs. S3 and S4.
Figure 4.
Figure 4.
SAXS-based ensemble modeling of ObgE_FL taking into account the flexibility of the C-terminal domain. a, ensemble fit of ObgE_FL (red line) to the experimental ObgE_FL SAXS profile (black trace). The residuals are shown at the bottom of the fit (dark green). b, the Rg distribution of the ensemble (red curve) compared with the Rg distribution of a random pool of models (gray filled area) generated using an ensemble optimization method coupled to all-atom modeling, model validation, and NMA refinement. c, ribbon representation of 5 ensemble models, selected by the genetic algorithm, which give an average theoretical curve that fits the experimental ObgE_FL SAXS profile as shown in a.
Figure 5.
Figure 5.
GDP and GTP binding and dissociation kinetics of ObgE_FL (a, c, and e) and ObgE_340 (b, d, and f) determined via stopped flow fluorescence analysis. a and b, transients obtained by following mGDP (0.2/0.1 μm, before/after mixing) fluorescence upon rapid mixing with different concentrations of ObgE_FL (a) and ObgE_340 (b). Concentration values given on the graph represent ObgE concentrations before and after mixing. The lower panels show the concentration dependence of the observed rate constant (kobs). The slope of the linear fit yields kon. c and d, transients obtained by following mGTP (0.2/0.1 μm, before/after mixing) fluorescence upon rapid mixing with different concentrations of ObgE_FL (c) and ObgE_340 (d). The same concentrations as in a and b are used. The lower panels show the concentration dependence of the observed rate constant (kobs). The slope and intercept of the linear fit yield kon and koff, respectively. e and f, direct determination of koff by following the release of mGDP from ObgE_FL (e) and ObgE_340 (f) upon mixing 200 μm unlabeled GDP with a mixture of 0.4 μm ObgE and 1.5 μm mGDP. g, summary of nucleotide binding/dissociation kinetics and the deduced KD values of ObgE_FL and ObgE_340.
Figure 6.
Figure 6.
ITC experiments for binding of ppGpp to ObgE_FL (a) and ObgE_340 (b), respectively. Experiments were performed at 25 °C by titrating ppGpp from a stock solution of 750 μm into a solution of 75 μm nucleotide-free ObgE. Equilibrium dissociation constants (KD) and binding stoichiometries (n) are given as the mean ± S.D. of 3 independent measurements (all isotherms are given in supplemental Fig. S9).
Figure 7.
Figure 7.
Stimulation of ObgE GTPase activity by the 70S ribosome. Initial rate kinetic traces (a) and deduced initial rates (b) for GTP (100 μm) hydrolysis by ObgE_FL (0.5 μm) without and with increasing concentrations of 70S ribosome. Time traces and initial rates are shown after subtraction of a background GTPase activity in the ribosomal preparation, probably due to a contaminating GTPase that copurified with the ribosome. Each data point represents the average ± S.D. of 3 independent measurements.

References

    1. Bourne H. R., Sanders D. A., and McCormick F. (1990) The GTPase superfamily: a conserved switch for diverse cell functions. Nature 348, 125–132 - PubMed
    1. Caldon C. E., and March P. E. (2003) Function of the universally conserved bacterial GTPases. Curr. Opin. Microbiol. 6, 135–139 - PubMed
    1. Verstraeten N., Fauvart M., Versées W., and Michiels J. (2011) The universally conserved prokaryotic GTPases. Microbiol. Mol. Biol. Rev. 75, 507–542 - PMC - PubMed
    1. Vetter I. R., and Wittinghofer A. (2001) The guanine nucleotide: binding switch in three dimensions. Science 294, 1299–1304 - PubMed
    1. Wittinghofer A., and Vetter I. R. (2011) Structure-function relationships of the G domain, a canonical switch motif. Annu. Rev. Biochem. 80, 943–971 - PubMed

MeSH terms

LinkOut - more resources