. 2018 Apr 27;293(17):6530-6543.
doi: 10.1074/jbc.RA117.001154. Epub 2018 Mar 9.

Inhibition of strigolactone receptors by N-phenylanthranilic acid derivatives: Structural and functional insights

Affiliations

Inhibition of strigolactone receptors by N-phenylanthranilic acid derivatives: Structural and functional insights

Cyril Hamiaux et al. J Biol Chem. .

Abstract

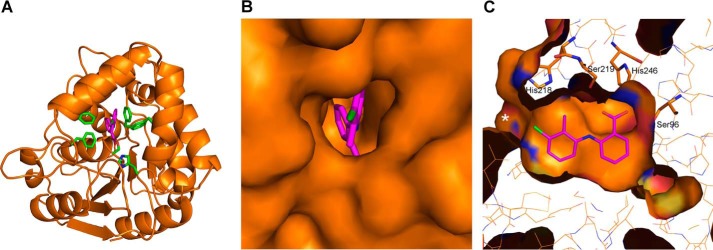
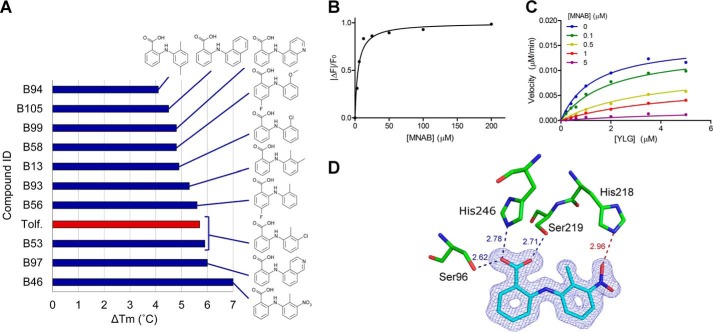
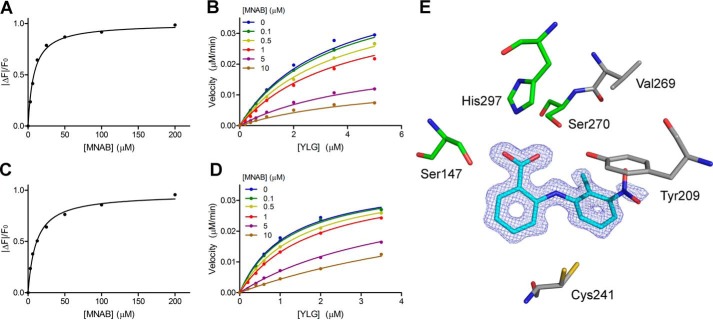
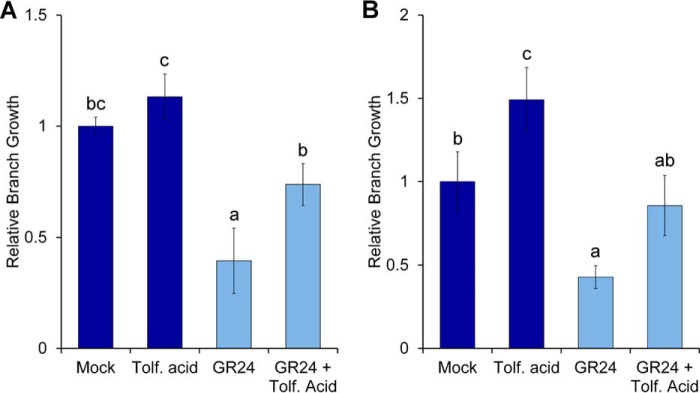
The strigolactone (SL) family of plant hormones regulates a broad range of physiological processes affecting plant growth and development and also plays essential roles in controlling interactions with parasitic weeds and symbiotic fungi. Recent progress elucidating details of SL biosynthesis, signaling, and transport offers many opportunities for discovering new plant-growth regulators via chemical interference. Here, using high-throughput screening and downstream biochemical assays, we identified N-phenylanthranilic acid derivatives as potent inhibitors of the SL receptors from petunia (DAD2), rice (OsD14), and Arabidopsis (AtD14). Crystal structures of DAD2 and OsD14 in complex with inhibitors further provided detailed insights into the inhibition mechanism, and in silico modeling of 19 other plant strigolactone receptors suggested that these compounds are active across a large range of plant species. Altogether, these results provide chemical tools for investigating SL signaling and further define a framework for structure-based approaches to design and validate optimized inhibitors of SL receptors for specific plant targets.

Keywords: chemical biology; crystal structure; hormone receptor; hydrolase; inhibition mechanism; plant hormone; strigolactone; strigolactone receptor inhibitor.


Conflict of interest statement

C. H., K. C. S., and the New Zealand Institute for Plant and Food Research Limited have filed a New Zealand provisional patent application (734620) that relates to the specific topic “Strigolactone receptor antagonists.”

Figures

Figure 1.
Figure 1.
High-throughput screening of DAD2 inhibitors using the DSF assay. A, experimental melting curves (top) and derivatives of the melting curves (bottom) obtained for DAD2 in the presence of DMSO, tolfenamic acid, mefenamic acid, and flufenamic acid. Dashed lines, measured melting temperatures of DAD2 from which melting shifts (ΔTm = Tm(compound)Tm(DMSO)) were calculated. B, chemical structures of the three identified inhibitors, tolfenamic acid, mefenamic acid, flufenamic acid, and of the parent compound, N-phenylanthranilic acid. The melting temperature shift of DAD2 (ΔTm) in the presence of inhibitors is indicated. Ring labels (X and Y) used throughout are labeled on the N-phenylanthranilic acid structure. C, hydrolysis reaction of the synthetic strigolactone GR24 by DAD2/D14 proteins.
Figure 2.
Figure 2.
TLC analysis of the rac-GR24 hydrolysis by DAD2 in the presence of tolfenamic, mefenamic, and flufenamic acid. DAD2 was first incubated with a 4-fold molar excess of inhibitors for 30 min at 20 °C. GR24 was then added to a final 20-fold molar excess, and reactions were incubated at 25 °C. A positive control consisted of DAD2 (25 μm), GR24 (500 μm), 5% DMSO in PBS, and a negative control was GR24 (500 μm), 5% DMSO in PBS. Compounds were extracted after 3 and 16 h of incubation and analyzed by TLC.
Figure 3.
Figure 3.
Yeast two-hybrid analysis of DAD2 interactions with downstream partners in the presence of inhibitors. Shown is inhibition of rac-GR24–induced DAD2/PhMAX2A (A) and DAD2/PhD53A (B) interactions by tolfenamic acid, mefenamic acid, and flufenamic acid. Protein-protein interactions are quantified by assaying β-gal activity in a yeast two-hybrid liquid culture system. Data points are the mean ± S.E. (error bars) of three technical replicates. *, GR24 treatments where the means are significantly different from the relevant 0 control (p < 0.01, Student's t test). Western blotting controls for expression of proteins in yeast are shown in Fig. S12.
Figure 4.
Figure 4.
DAD2 inhibition by tolfenamic acid. A, structure of DAD2 bound to tolfenamic acid. DAD2 is drawn in ribbon mode and rainbow-colored from blue (N terminus) to red (C terminus). The catalytic triad residues and tolfenamic acid (pink) are shown in stick mode. The final σA-weighted map contoured at 1.3σ around tolfenamic acid is shown in dark blue (the corresponding omit map is shown in Fig. S2). B, tolfenamic acid binding mode within DAD2's internal cavity. Oxygen, nitrogen, and chlorine atoms are represented in red, blue, and green spheres, respectively. Carbon atoms are shown as gray spheres for protein atoms, and light blue spheres for tolfenamic acid. Hydrogen bonds are shown as dotted blue lines, with distances (in Å) between polar atoms indicated. Hydrophobic interactions are represented by a thick green line. Specific π–π stacking interactions are shown as dotted green lines and labeled T and P for perpendicular T-stack and parallel stack, respectively. Residue numbers are indicated in gray. Ring labels (X and Y) used throughout are indicated in blue. C, intrinsic fluorescence of DAD2 in the presence of tolfenamic acid and rac-GR24. Each data point is the mean ± S.E. (error bars) of three technical replicates. D, competition assay of YLG hydrolysis by DAD2 using tolfenamic acid. Each data point is the average of three technical replicates. All of the individual replicates for each compound concentration were included during the nonlinear global fit analysis using a mixed-inhibition model. See also Table S2.
Figure 5.
Figure 5.
Structure of tolfenamic acid bound inside DAD2's internal cavity. A, overview of the crystal structure of DAD2 bound to tolfenamic acid. Tolfenamic acid is drawn in pink, whereas key DAD2-binding residues (Phe27, Ser96, Phe125, Phe158, Phe194, and His248 are drawn in green). B, close-up of DAD2 surface looking at the cavity entrance, in the same orientation as A. C, side view of tolfenamic acid bound inside DAD2's cavity. The view is rotated ∼90° along the y axis and 180° along the x axis compared with A and B. His218, Ser219, His246, and Ser96 are drawn in stick mode. The cavity entrance is indicated by a white asterisk.
Figure 6.
Figure 6.
SAR study of DAD2 inhibitors. A, structures of the top 10 compounds of the SAR study, as assessed by decreasing values of DAD2's melting temperature shifts in the DSF assay. The red bar corresponds to known tolfenamic acid (Tolf.) used as reference. The experimental melting curves and derivatives of the melting curves for DAD2 in the presence of the top 10 compounds are shown in Fig. S5. Compound IDs for the SAR study were B1–B136, as detailed in Table S3. B, binding of MNAB to DAD2 using intrinsic fluorescence experiments. Each data point is the mean ± S.E. (error bars) of three technical replicates. C, competition of YLG hydrolysis by DAD2 using MNAB. Each data point is the average of three technical replicates. All of the individual replicates for each compound concentration were included during the nonlinear global fit analysis using a mixed-inhibition model. D, MNAB bound to DAD2. The final σA-weighted map contoured at 1.0σ around MNAB is shown in dark blue (the corresponding omit map is shown in Fig. S2). DAD2 residues involved in polar interactions with MNAB are shown. Hydrogen bonds are shown as dotted lines, with distances (in Å) between polar atoms indicated. The additional hydrogen bond between the nitro group of MNAB and His246 is shown as a dotted red line. See also Table S2.
Figure 7.
Figure 7.
OsD14 and AtD14 inhibition by MNAB. A, binding of MNAB to OsD14 using intrinsic fluorescence experiments. Each data point is the mean ± S.E. (error bars) of three technical replicates. B, competition of YLG hydrolysis by OsD14 using MNAB. Each data point is the average of three technical replicates. All of the individual replicates for each compound concentration were included during the nonlinear global fit analysis using a mixed-inhibition model. C and D, same as A and B, respectively, for AtD14. E, MNAB bound to OsD14 in the same orientation as in Fig. 6. The final σA-weighted map contoured at 1.0σ around MNAB is shown in dark blue (the corresponding omit map is shown in Fig. S2). Nonconserved residues between OsD14 and DAD2 are shown in gray: Val269 (His218 in DAD2), Tyr209 (Phe158), and Cys241 (Ser190). All other residues lining the internal cavity are conserved between the two proteins. See also Table S2.
Figure 8.
Figure 8.
In vivo activity of tolfenamic acid. A, bud growth assay of petunia plants decapitated after leaf 2, treated with 0.5 μm GR24 and/or 50 μm tolfenamic acid. The numbers of leaves produced at the two leaf axils for each treatment were normalized relative to the mock-treated control (n = 10–11; data shown are mean ± S.E. (error bars)). B, bud growth assay of Arabidopsis two-node stem segments, treated with 0.5 μm GR24 and/or 5 μm tolfenamic acid. Total bud lengths for the two nodes were normalized relative to the mock-treated control (n = 16; data shown are mean ± S.E.). Statistical tests of differences between treatments were calculated by analysis of variance and Fisher's protected LSD multiple comparisons test (p = 0.05).
Figure 9.
Figure 9.
Importance of the activation loop. A, surface representation of DAD2 in complex with tolfenamic acid. Tolfenamic acid bound inside the cavity is drawn in cyan, and residues from the activation loop (Gln213–Ala222) are shown in green. B, same as A with DAD2 drawn in ribbon mode. Ser219 is drawn in stick mode (green) and indicated. The part of the lid that undergoes conformation change when interacting with MAX2 is colored in orange. C, structure of the D14-D3 complex (PDB entry 5HZG). D14 is colored with the same color scheme as DAD2 in B. The disordered activation loop is represented by a green dashed line. D3 is shown in brown.

References

    1. Woo H. R., Chung K. M., Park J.-H., Oh S. A., Ahn T., Hong S. H., Jang S. K., and Nam H. G. (2001) ORE9, an F-Box protein that regulates leaf senescence in Arabidopsis. Plant Cell 13, 1779–1790 10.2307/3871318 - DOI - PMC - PubMed
    1. Yamada Y., Furusawa S., Nagasaka S., Shimomura K., Yamaguchi S., and Umehara M. (2014) Strigolactone signaling regulates rice leaf senescence in response to a phosphate deficiency. Planta 240, 399–408 10.1007/s00425-014-2096-0 - DOI - PubMed
    1. Gomez-Roldan V., Fermas S., Brewer P. B., Puech-Pagès V., Dun E. A., Pillot J.-P., Letisse F., Matusova R., Danoun S., Portais J.-C., Bouwmeester H., Becard G., Beveridge C. A., Rameau C., and Rochange S. F. (2008) Strigolactone inhibition of shoot branching. Nature 455, 189–194 10.1038/nature07271 - DOI - PubMed
    1. Kapulnik Y., Delaux P. M., Resnick N., Mayzlish-Gati E., Wininger S., Bhattacharya C., Séjalon-Delmas N., Combier J. P., Bécard G., Belausov E., Beeckman T., Dor E., Hershenhorn J., and Koltai H. (2011) Strigolactones affect lateral root formation and root-hair elongation in Arabidopsis. Planta 233, 209–216 10.1007/s00425-010-1310-y - DOI - PubMed
    1. Rasmussen A., Mason M. G., De Cuyper C., Brewer P. B., Herold S., Agusti J., Geelen D., Greb T., Goormachtig S., Beeckman T., and Beveridge C. A. (2012) Strigolactones suppress adventitious rooting in Arabidopsis and pea. Plant Physiol. 158, 1976–1987 10.1104/pp.111.187104 - DOI - PMC - PubMed

Publication types

MeSH terms

LinkOut - more resources