. 2019 Apr 12;294(15):6157-6171.
doi: 10.1074/jbc.RA118.005697. Epub 2019 Feb 6.

Functional genomics of epilepsy-associated mutations in the GABAA receptor subunits reveal that one mutation impairs function and two are catastrophic

Affiliations

Functional genomics of epilepsy-associated mutations in the GABAA receptor subunits reveal that one mutation impairs function and two are catastrophic

Nathan L Absalom et al. J Biol Chem. .

Abstract

A number of epilepsy-causing mutations have recently been identified in the genes of the α1, β3, and γ2 subunits comprising the γ-aminobutyric acid type A (GABAA) receptor. These mutations are typically dominant, and in certain cases, such as the α1 and β3 subunits, they may lead to a mix of receptors at the cell surface that contain no mutant subunits, a single mutated subunit, or two mutated subunits. To determine the effects of mutations in a single subunit or in two subunits on receptor activation, we created a concatenated protein assembly that links all five subunits of the α1β3γ2 receptor and expresses them in the correct orientation. We created nine separate receptor variants with a single-mutant subunit and four receptors containing two subunits of the γ2R323Q, β3D120N, β3T157M, β3Y302C, and β3S254F epilepsy-causing mutations. We found that the singly mutated γ2R323Q subunit impairs GABA activation of the receptor by reducing GABA potency. A single β3D120N, β3T157M, or β3Y302C mutation also substantially impaired receptor activation, and two copies of these mutants within a receptor were catastrophic. Of note, an effect of the β3S254F mutation on GABA potency depended on the location of this mutant subunit within the receptor, possibly because of the membrane environment surrounding the transmembrane region of the receptor. Our results highlight that precise functional genomic analyses of GABAA receptor mutations using concatenated constructs can identify receptors with an intermediate phenotype that contribute to epileptic phenotypes and that are potential drug targets for precision medicine approaches.

Keywords: GABA receptor; brain disorder; channel activation; concatemer; cryo-electron microscopy; epilepsy; heterozygous; missense; neurotransmission; neurotransmitter; synaptic transmission.


Conflict of interest statement

The authors declare that they have no conflicts of interest with the contents of this article

Figures

Figure 1.
Figure 1.
A, pentameric structure of the GABA and diazepam-bound α1β3γ2 receptor (PDB code 6HUP) from above showing the orientation of the subunits. The subunits are colored with respect to their order in the pentamer: first γ2 (green), second β3 (maroon), third α1 (blue), fourth β3 (red), and fifth α1 (dark blue). B, side view showing the first γ2 subunit adjacent to the second β3 subunit. The γ2R323 residue on the M2-M3 loop is depicted with the side chain in black in a transparent sphere. C, side view showing the fourth β3 subunit adjacent to the fifth α1 subunit, with the GABA-binding site highlighted. The side chains of the β3D120N residue at the GABA-binding site, the β3T157M residue within an internal β-sheet, the β3Y302C residue in the M2-M3 loop, and the β3S254F residue in the M1 region are shown in black.
Figure 2.
Figure 2.
A, schematic of the coding region of concatenated receptor containing the DNA construct. Linker lengths are 15 amino acids ((AGS)5), 27 amino acids ((AGS)5LGS(AGS)3), 18 amino acids (AGT(AGS)5), and 27 amino acids ((AGS)4AGT(AGS)4). B, schematic of the expected arrangement of the concatenated receptor where the subunits arrange in a counter-clockwise orientation. GABA- and clobazam-binding sites are shown. C, representative data (above) from a single two-electrode voltage clamp experiment where different concentrations of GABA (open bars) were applied to construct a concentration–response curve to GABA (below). Filled bars, reference 3 mm GABA applications; open bars, GABA applications at concentrations shown. Peak currents were measured, and the mean ± S.E. (error bars) was plotted (open circles) and fitted to the Hill equation (below). D, representative data (above) from a single two-electrode voltage clamp experiment constructing a modulation curve to clobazam (below). Three pulses of reference 10 μm GABA (closed bars) were applied prior to co-application of 10 μm GABA and clobazam at concentrations shown (closed bars). Percent modulation of the control GABA response was calculated, and the mean ± S.E. was plotted and fitted to the Hill equation (below). The fitted EC50 of clobazam was 86 nm (log EC50 = −4.03 ± 0.06, mean ± S.E., n = 10), and the fitted Emax was 306% (320 ± 32, mean ± S.E., n = 10).
Figure 3.
Figure 3.
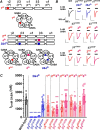
A, schematic of concatenated receptor indicating the location of mutations when they are introduced into the γ2 or distinct β3 subunits. Red circles indicate the location of mutations on the first γ2 subunit, and red circles, purple squares, and blue circles indicate location of mutations on the second, fourth, or both second and fourth β3 subunits, respectively. B, representative traces of WT and γ2R323Q, β3D120N, β3T157M, β3S254F, and β3Y302C mutant receptors with mutation(s) in the labeled locations after application of reference 3 mm GABA (filled bars). Scale bars, 500 nA and 100 s. C, absolute current elicited by 3 mm GABA after injection of 2 ng of RNA. Individual data points are depicted as either open circles or squares with WT as black bars and gray circles and a color and pattern scheme identical to that in A. Bars and error bars represent mean ± S.D. of 10–13 individual cells. *, p < 0.05; **, p < 0.01; ***, p < 0.001 compared with WT, one-way ANOVA with Tukey's post hoc test.
Figure 4.
Figure 4.
A, schematic of concatenated receptor indicating the location of the γ2R323Q mutation (red circle) within the concatenated construct (left). Shown are representative data (right) from a single two-electrode voltage clamp experiment where different concentrations of GABA (open bars) were applied to construct a concentration–response curve to GABA at γ2R323Q-β3-α1-β3-α1 receptors. Filled dark red bars and traces represent reference 3 mm GABA applications, and open red bars and traces represent GABA applications at the concentrations shown. Shown is a concentration–response curve to GABA (below) of WT γ2-β3-α1-β3-α1 (○) and γ2R323Q-β3-α1-β3-α1 (○) receptors normalized to the Est. Po(max) and fitted to the Hill equation. Dots, mean ± S.E. (error bars) of 10–13 individual experiments. The EC50 of the mutant receptor derived from the curve fit is shown. *, p < 0.05; **, p < 0.01; ***, p < 0.001 compared with WT, one-way ANOVA with Tukey's post hoc test. B, representative traces of WT (black) and γ2R323Q (red) mutant receptors after application of reference 3 mm GABA (filled bars) and 10 mm GABA, 1 μm diazepam, and 3 μm etomidate (open bars), respectively. Scale bars, 500 nA and 100 s. The Est. GABA Po(max) of WT (○) and γ2R323Q (○) mutant receptors (below) was determined by dividing the current elicited by 3 mm GABA by the current elicited by 10 mm GABA, 1 μm diazepam, and 3 μm etomidate and corrected for the reference 3 mm GABA current. Lines and error bars represent the mean ± S.D. of 10 individual cells.
Figure 5.
Figure 5.
A, schematic of concatenated receptor indicating the location of β3D120N and β3T157M mutations introduced within the second (closed red circle), fourth (closed purple square) or the second and fourth (closed blue circles) subunits within the resulting pentameric receptor. B, concentration–response curve to GABA of WT γ2-β3-α1-β3-α1 (open black circle), γ2-β3D120N-α1-β3-α1 (open red circle), γ2-β3-α1-β3D120N-α1 (open purple square), and γ2-β3D120N-α1-β3D120N-α1 (closed blue circle) receptors; C, Concentration–response curve to GABA of WT γ2-β3-α1-β3-α1 (open black circle), γ2-β3T157M-α1-β3-α1 (open red circle), γ2-β3-α1-β3T157M-α1 (open purple square), and γ2-β3T157M-α1-β3T157M-α1 (closed blue circle) receptors normalized to the Est. Po(max) and fitted to the Hill equation. The EC50 of the mutant receptor derived from the curve fit is shown. *, p < 0.05; **, p < 0.01; ***, p < 0.001 compared with WT, one-way ANOVA with Tukey's post hoc test. D, representative traces of β3D120N and β3T157M receptors after application of 3 mm GABA (filled bars) and 10 mm GABA, 1 μm diazepam, and 3 μm etomidate (open bars), respectively. Red traces indicate mutation at the second subunit location, and purple traces indicate mutation at the fourth. Scale bars, 500 nA and 100 s. E, estimated GABA Po(max) of WT, β3D120N, and β3T157M receptors was determined by dividing the current elicited by 3 mm GABA by the current elicited by 10 mm GABA, 1 μm diazepam, and 3 μm etomidate and corrected for the reference 3 mm GABA. Open gray circles, WT; open red circles, receptors with a mutation in the second position; open purple squares, receptors with a mutation in the fourth position. Lines and error bars represent mean ± S.D. of 10 individual cells.
Figure 6.
Figure 6.
A, concentration–response curve to GABA of WT γ2-β3-α1-β3-α1 (open black circles), γ2-β3Y302C-α1-β3-α1 (open red circles), γ2-β3-α1-β3Y302C-α1 (open purple squares) and γ2-β3Y302C-α1-β3Y302C-α1 (closed blue circles) receptors normalized to the Est. Po(max) and fitted to the Hill equation. Dots, mean ± S.E. (error bars) of 10–13 individual experiments. The EC50 of the mutant receptor derived from the curve fit is shown. *, p < 0.05; **, p < 0.01; ***, p < 0.001 compared with WT, one-way ANOVA with Tukey's post hoc test. B, representative traces of β3Y302C mutant receptors after application of reference 3 mm GABA (filled bars) and 10 mm GABA, 1 μm diazepam, and 3 μm etomidate (open bars), respectively. Red traces indicate mutation at the second subunit location, purple indicates mutation at the fourth subunit location, and blue indicates mutation at both the second and fourth locations. Scale bars, 500 nA and 100 s. C, estimated GABA Po(max) of WT γ2-β3-α1-β3-α1 (open black circles), γ2-β3Y302C-α1-β3-α1 (open red circles), γ2-β3-α1-β3Y302C-α1 (open purple squares) and γ2-β3Y302C-α1-β3Y302C-α1 (closed blue circles) mutant receptors. Est. Po(max) was determined by dividing the current elicited by 3 mm GABA by the current elicited by 10 mm GABA, 1 μm diazepam, and 3 μm etomidate and corrected where 3 mm GABA was not at the maximum of the concentration–response curves. Lines and bars, mean ± S.D. of 10 individual cells. *, p < 0.05; **, p < 0.01; ***, p < 0.001 compared with WT, one-way ANOVA with Tukey's post hoc test. D, concentration–response curve to GABA of WT γ2-β3-α1-β3-α1 (open black circles), γ2-β3S254F-α1-β3-α1 (open red circles), γ2-β3-α1-β3S254F-α1 (open purple squares), and γ2-β3S254F-α1-β3S254F-α1 (closed blue circles) receptors normalized to the Est. Po(max) and fitted to the Hill equation. Dots, mean ± S.E. of 10–13 individual experiments. The EC50 of the mutant receptor derived from the curve fit is shown. *, p < 0.05; **, p < 0.01; ***, p < 0.001 compared with WT, one-way ANOVA with Tukey's post hoc test. E, representative traces of β3Y302C mutant receptors after application of reference 3 mm GABA (filled bars) and 10 mm GABA, 1 μm diazepam, and 3 μm etomidate (open bars), respectively. Red traces, mutation at the second subunit location; purple traces, mutation at the fourth subunit location; blue traces, mutation at both the second and fourth locations. Scale bars, 500 nA and 100 s. F, estimated GABA Po(max) of WT γ2-β3-α1-β3-α1 (open gray circles), γ2-β3S254F-α1-β3-α1 (open red circles), γ2-β3-α1-β3S254F-α1 (open purple squares), and γ2-β3S254F-α1-β3S254F-α1 (closed blue circles) mutant receptors. Est. Po(max) was determined by dividing the current elicited by 3 mm GABA by the current elicited by 10 mm GABA, 1 μm diazepam, and 3 μm etomidate and corrected where 3 mm GABA was not at the maximum of the concentration–response curves. Lines and error bars, mean ± S.D. of 10 individual cells. *, p < 0.05; **, p < 0.01; ***, p < 0.001 compared with WT, one-way ANOVA with Tukey's post hoc test.
Figure 7.
Figure 7.
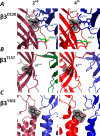
A–C, enlarged view of the α1β3γ2 cryo-EM structure (PDB code 6HUP) (41) showing the β3 mutant residues β3D120 (A), β3T157 (B), and β3Y302 (C) in the two different subunit locations of the second β3 subunit (left) and fourth β3 subunit (right). The subunits are colored with the first γ2 subunit in green, the second β3 subunit in maroon, the third α1 subunit in light blue, the fourth β3 subunit in red, and the fifth α1 subunit in dark blue and the GABA molecule in blue, red, and green. Residues from the adjacent α1 or γ2 subunits are indicated. At the β1D120 (A), β1T1577 (B), and β1Y302 (C) residues, the interacting partners are identical residues either on the adjacent subunit or within the β3 subunit itself.
Figure 8.
Figure 8.
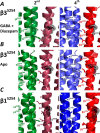
A–C, enlarged view of the GABA and diazepam-bound α1β3γ2 cryo-EM structure (PDB code 6HUP) (A), apo-α1β3γ2 (PDB 6i53) (B), and α1β1γ2 (PDB code 6DW0) (C) (40, 41) showing the β3S254 or β1S254 mutant residues in the two different subunit locations of the second β3 subunit (left) and fourth β3 subunit (right). The subunits are colored with the first γ2 subunit in green, the second β3 subunit in maroon, the third α1 subunit in light blue, the fourth β3 subunit in red, and the fifth α1 subunit in dark blue. Residues from adjacent α1 or γ2 subunits are indicated. Although the interacting partners of the Ser-254 residue are within the β subunit, the increased volume of the phenylalanine residue that substitutes for the serine at position 254 will cause the helix to occupy the space closer to the M3 helix of the adjacent subunit. When in the second position in the apo or α1β1γ2 structures, the M3 helix of the γ2 helix is kinked rather than parallel to the M1 helix of the β subunit. The residues of the M1 and M3 that face each other are the β1M253, β1L256, and β1I259 residues for both subunits; the γ2V341, γ2I344, γ2F345, and γ2S348 residues of the first subunit (left); and the α1Y321, α1F323, and α1Y325 residues of the third subunit (right). At the locations of all of these mutations, the sequence between β1 and β3 is identical.

References

    1. Howard M. A., and Baraban S. C. (2017) Catastrophic epilepsies of childhood. Annu. Rev. Neurosci. 40, 149–166 10.1146/annurev-neuro-072116-031250 - DOI - PubMed
    1. Cossette P., Liu L., Brisebois K., Dong H., Lortie A., Vanasse M., Saint-Hilaire J. M., Carmant L., Verner A., Lu W. Y., Wang Y. T., and Rouleau G. A. (2002) Mutation of GABRA1 in an autosomal dominant form of juvenile myoclonic epilepsy. Nat. Genet. 31, 184–189 10.1038/ng885 - DOI - PubMed
    1. Gontika M. P., Konialis C., Pangalos C., and Papavasiliou A. (2017) Novel SCN1A and GABRA1 gene mutations with diverse phenotypic features and the question on the existence of a broader spectrum of Dravet syndrome. Child Neurol. Open 4, 2329048X17706794 10.1177/2329048X17706794 - DOI - PMC - PubMed
    1. Hernandez C. C., Klassen T. L., Jackson L. G., Gurba K., Hu N., Noebels J. L., and Macdonald R. L. (2016) Deleterious rare variants reveal risk for loss of GABAA receptor function in patients with genetic epilepsy and in the general population. PLoS One 11, e0162883 10.1371/journal.pone.0162883 - DOI - PMC - PubMed
    1. Johannesen K., Marini C., Pfeffer S., Møller R. S., Dorn T., Niturad C. E., Gardella E., Weber Y., Søndergård M., Hjalgrim H., Nikanorova M., Becker F., Larsen L. H., Dahl H. A., Maier O., et al. (2016) Phenotypic spectrum of GABRA1: from generalized epilepsies to severe epileptic encephalopathies. Neurology 87, 1140–1151 10.1212/WNL.0000000000003087 - DOI - PubMed

Publication types