. 2020 Feb 11;117(6):3063-3073.
doi: 10.1073/pnas.1914308117. Epub 2020 Jan 23.

A molecular basis for the T cell response in HLA-DQ2.2 mediated celiac disease

Affiliations

A molecular basis for the T cell response in HLA-DQ2.2 mediated celiac disease

Yi Tian Ting et al. Proc Natl Acad Sci U S A. .

Abstract

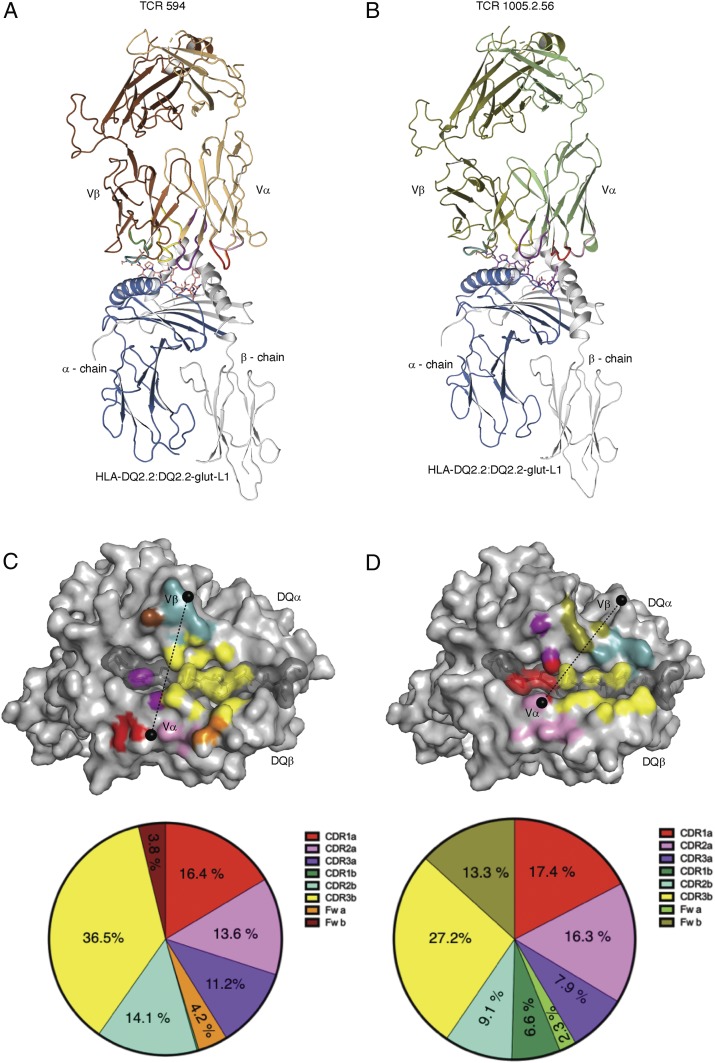
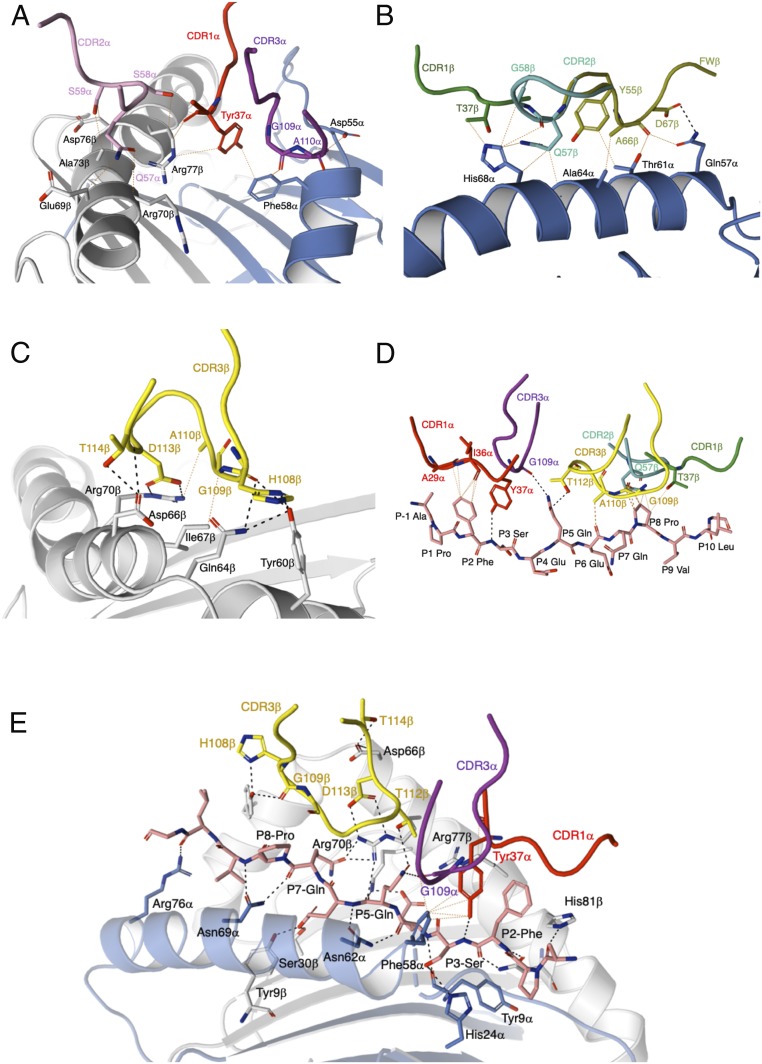
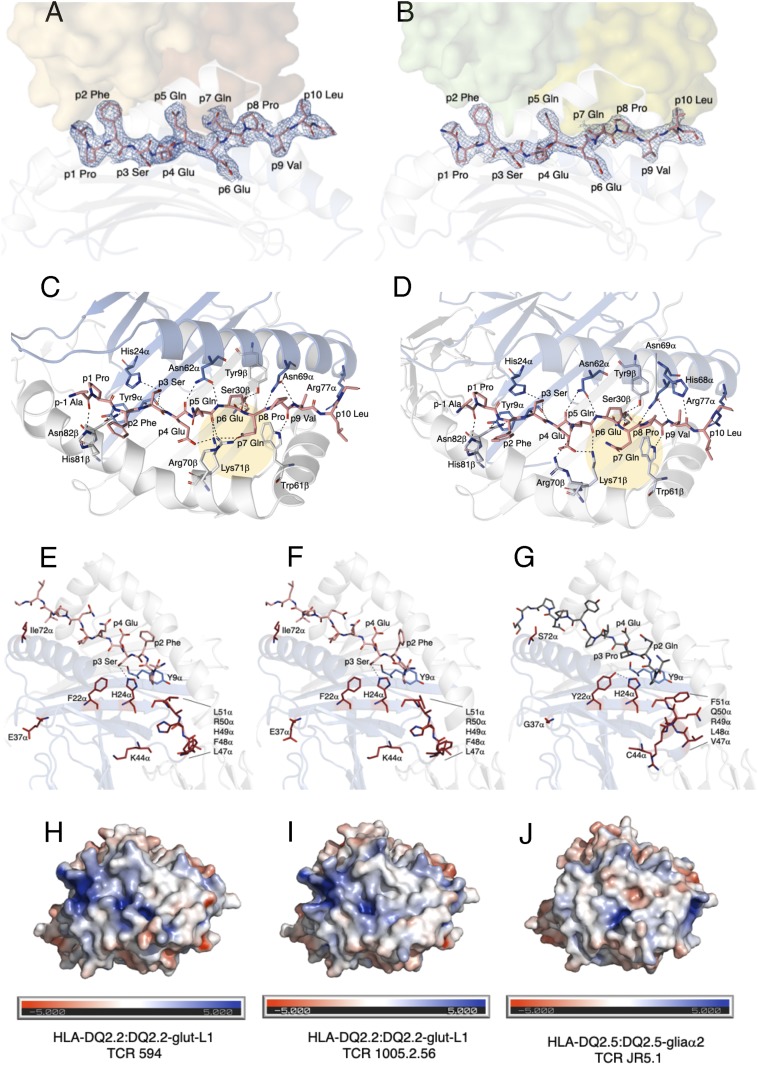
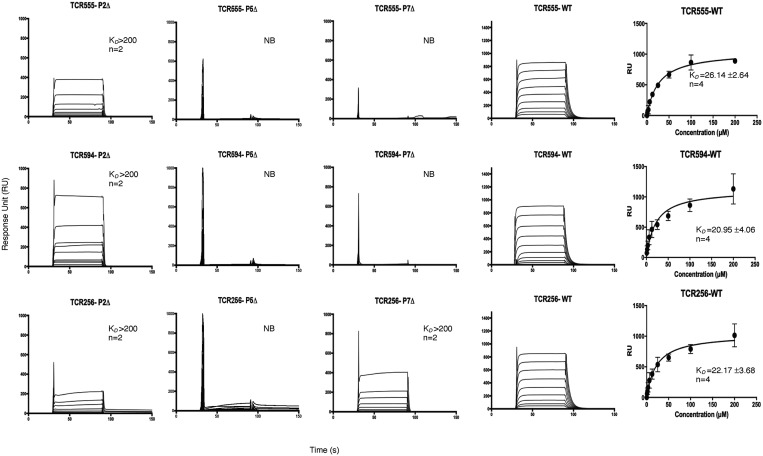
The highly homologous human leukocyte antigen (HLA)-DQ2 molecules, HLA-DQ2.5 and HLA-DQ2.2, are implicated in the pathogenesis of celiac disease (CeD) by presenting gluten peptides to CD4+ T cells. However, while HLA-DQ2.5 is strongly associated with disease, HLA-DQ2.2 is not, and the molecular basis underpinning this differential disease association is unresolved. We here provide structural evidence for how the single polymorphic residue (HLA-DQ2.5-Tyr22α and HLA-DQ2.2-Phe22α) accounts for HLA-DQ2.2 additionally requiring gluten epitopes possessing a serine at the P3 position of the peptide. In marked contrast to the biased T cell receptor (TCR) usage associated with HLA-DQ2.5-mediated CeD, we demonstrate with extensive single-cell sequencing that a diverse TCR repertoire enables recognition of the immunodominant HLA-DQ2.2-glut-L1 epitope. The crystal structure of two CeD patient-derived TCR in complex with HLA-DQ2.2 and DQ2.2-glut-L1 (PFSEQEQPV) revealed a docking strategy, and associated interatomic contacts, which was notably distinct from the structures of the TCR:HLA-DQ2.5:gliadin epitope complexes. Accordingly, while the molecular surfaces of the antigen-binding clefts of HLA-DQ2.5 and HLA-DQ2.2 are very similar, differences in the nature of the peptides presented translates to differences in responding T cell repertoires and the nature of engagement of the respective antigen-presenting molecules, which ultimately is associated with differing disease penetrance.

Keywords: T cell receptor; X-ray crystallography; celiac disease; human leukocyte antigen.


Conflict of interest statement

The authors declare no competing interest.

Figures

Fig. 1.
Fig. 1.
Structures of TCR-HLA-DQ2.2:DQ2.2-glut-L1 ternary complexes. TCR 594 (A) and TCR 1005.2.56 (B). Footprint of the CDR loops of the TCR 594 (C) and TCR 1005.2.56 (D) on the HLA-DQ2.2:DQ2.2-glut-L1. CDR1α, CDR2α, and CDR3α are colored in red, pink, and purple, respectively, while the CDR1β, CDR2β, and CDR3β are colored in green, light teal, and yellow, respectively. The TCR framework for each Vα- and Vβ-chain is colored orange and brown, respectively, for TCR 594, and colored lime and deep-olive, respectively, for TCR 1005.2.56. The pie chart below show percentage of the CDR loops contributing to the buried surface area.
Fig. 2.
Fig. 2.
TCR 594 CDR loops in contact with the HLA-DQ2.2:DQ2.2-glut-L1. (A) The CDR1α and CDR2α loop contacting HLA-DQ2.2 β-chain. (B) The CDR2β contacts with HLA-DQ2.2 α-chain. (C) CDR3α and CDR3β interactions with the DQ2.2-glut-L1 peptide. (D) Key interaction around the P5-Gln residue of the DQ2.2-glut-L1 epitope.
Fig. 3.
Fig. 3.
TCR 1005.2.56 CDR loops in contact with the HLA-DQ2.2:DQ2.2-glut-L1. (A) The CDR1α, CDR2α, and CDR3α loops contact the HLA-DQ2.2 α-chain and β-chain. The CDR1β, CDR2β (B), and CDR3β (C) interactions with the HLA-DQ2.2 α-chain and β-chain, respectively. (D) The CDR1α and CDR3β loops of the TCR 1005.2.56 that interacted the DQ2.2-glut-L1 peptide. The CDR3α, CDR1β, and CDR2β loop contacts with the peptide. (E) Key interaction around the P5-Gln and P7-Gln residue of the DQ2.2-glut-L1 epitope.
Fig. 4.
Fig. 4.
Comparison of HLA-DQ2.2-glut-L1 and HLA-DQ2.5 in complexed with gluten epitopes. The DQ2.2-glut-L1 peptide is bound in the peptide-binding groove, with carbon colored in salmon, nitrogen colored in blue, and oxygen colored in red. The TCR 594 (A) and TCR 1002.56 (B) docked on top of the HLA-DQ2.2:DQ2.2-glut-L1 are shown as solid surface, and each of the TCR αβ pair were colored in brown/orange and green/lime, respectively. The peptide’s 2Fo-Fc electron density map is shown in blue and contoured to 1 σ. Hydrogen bond interactions between HLA-DQ2.2 and the DQ2.2-glut-L1 epitope in the TCR 594:HLA-DQ2.2:DQ2.2-glut-L1 ternary complex (C) and in the TCR 1005.2.56:HLA-DQ2.2:DQ2.2.-glut-L1 ternary complex (D) are shown. Comparison of the DQ2.2-glut-L1 peptide bound to HLA-DQ2.2 in the two ternary complexes solved showed minor movement in P7-Gln residues, highlighted in yellow circle. Polymorphic residues on the ectodomain of HLA-DQ differing between HLA-DQ2.2 (E and F) and HLA-DQ2.5 (G) are represented in stick and colored in fire-brick. The His24α interacts with P3-Ser in DQ2.2-glut-L1 (E and F) but with Tyr22α in HLA-DQ2.5 (G). The solvent-accessible electrostatic potential was calculated for HLA-DQ2.2:DQ2.2-glut-L1 in complexed with TCR 594 (H) or TCR 1005.2.56 (I) and HLA-DQ2.5:DQ2.5-glia-α-2 (J). Electrostatic calculations were performed using APBS (±5 kT/e).
Fig. 5.
Fig. 5.
Binding of unsubstituted and P3-susbstituted variants of the DQ2.2-glut-L1 epitope to HLA-DQ2.2 and HLA-DQ2.5. Synthetic peptides containing the DQ2.2-glut-L1 epitope (Ac-QQPPFSEQEQPVLPQ, nine amino acid core sequence underlined), and variants substituted at P3 serine were tested as competitor peptides. The inhibitory effect of the competitor peptides is shown as IC50 values. One 10-fold titration experiment and three 4-fold titration experiments were performed. (A) Representative data showing results of one of the three fourfold titration experiments. (B) Results from all four independents experiments depicted as relative binding capacities (i.e., compared to the unsubstituted DQ2.2-glut-L1 epitope). The relative binding values from each experiment are shown as dots with bars representing mean values. A missing dot for some peptides is due to the titration curve not reaching its relevant IC50 value. Error bars, SD.
Fig. 6.
Fig. 6.
Affinity measurement of TCR 555, 594, and 1005.2.56. Affinity for HLA-DQ2.2:DQ2.2-glut-L1 WT and the P2-Ala, P5-Ala, and P-7Ala epitope mutants were measure via SPR. Two to four independent experiments (with the number of replicates shown as n numbers) were carried out for each of the TCR against each of HLA-DQ2.2-glut-L1 WT and epitope mutants. Binding curve showed represent an independent experiment of TCR 555, TCR 594, TCR 1005.2.56 (labeled as TCR256) binding to HLA-DQ2.2:DQ2.2-glut-L1. All data were combined for each TCR and a one-site specific-binding model was used for curve fitting. HLA-DQ2.5-CLIP was used as negative control and acted as baseline reference value. Error bars, SD. NB, no binding.

References

    1. Abadie V., Sollid L. M., Barreiro L. B., Jabri B., Integration of genetic and immunological insights into a model of celiac disease pathogenesis. Annu. Rev. Immunol. 29, 493–525 (2011). - PubMed
    1. Molberg O., et al. , Gliadin specific, HLA DQ2-restricted T cells are commonly found in small intestinal biopsies from coeliac disease patients, but not from controls. Scand. J. Immunol. 46, 103–109 (1997). - PubMed
    1. Risnes L. F., et al. , Disease-driving CD4+ T cell clonotypes persist for decades in celiac disease. J. Clin. Invest. 128, 2642–2650 (2018). - PMC - PubMed
    1. Sollid L. M., Jabri B., Triggers and drivers of autoimmunity: Lessons from coeliac disease. Nat. Rev. Immunol. 13, 294–302 (2013). - PMC - PubMed
    1. Jabri B., Sollid L. M., T cells in celiac disease. J. Immunol. 198, 3005–3014 (2017). - PMC - PubMed

Publication types

MeSH terms