. 2023 Oct 13;7(1):e202302080.
doi: 10.26508/lsa.202302080. Print 2024 Jan.

Structural insights into the complex of oncogenic KRas4BG12V and Rgl2, a RalA/B activator

Affiliations

Structural insights into the complex of oncogenic KRas4BG12V and Rgl2, a RalA/B activator

Mishal Tariq et al. Life Sci Alliance. .

Abstract

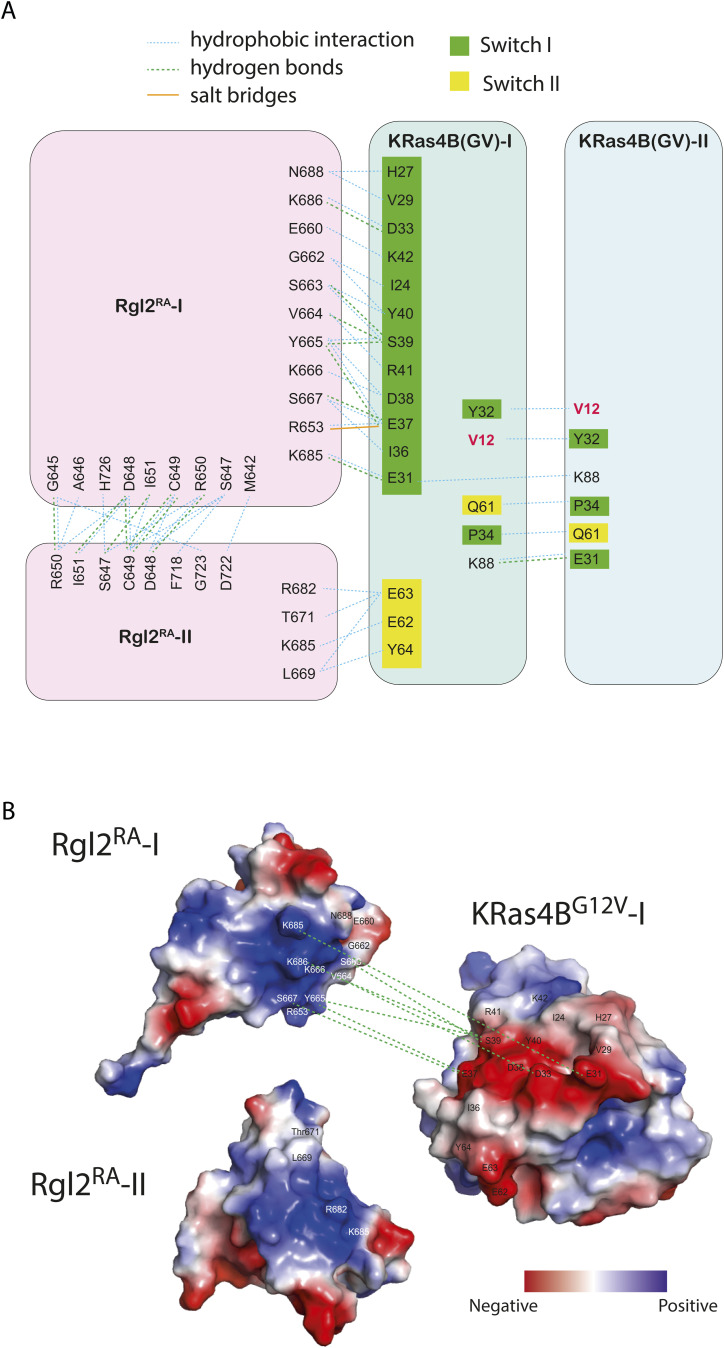
About a quarter of total human cancers carry mutations in Ras isoforms. Accumulating evidence suggests that small GTPases, RalA, and RalB, and their activators, Ral guanine nucleotide exchange factors (RalGEFs), play an essential role in oncogenic Ras-induced signalling. We studied the interaction between human KRas4B and the Ras association (RA) domain of Rgl2 (Rgl2RA), one of the RA-containing RalGEFs. We show that the G12V oncogenic KRas4B mutation changes the interaction kinetics with Rgl2RA The crystal structure of the KRas4BG12V: Rgl2RA complex shows a 2:2 heterotetramer where the switch I and switch II regions of each KRasG12V interact with both Rgl2RA molecules. This structural arrangement is highly similar to the HRasE31K:RALGDSRA crystal structure and is distinct from the well-characterised Ras:Raf complex. Interestingly, the G12V mutation was found at the dimer interface of KRas4BG12V with its partner. Our study reveals a potentially distinct mode of Ras:effector complex formation by RalGEFs and offers a possible mechanistic explanation for how the oncogenic KRas4BG12V hyperactivates the RalA/B pathway.


Conflict of interest statement

The authors declare that they have no conflict of interest.

Figures

Figure S1.
Figure S1.. Rgl2 Ras-binding domain interacts with active KRas4BG12V.
(A) A schematic diagram of the domain organisation of human Rgl2 as defined in the UniProt database (UniProt number: O15211). A domain spanning amino acid residues 648–735 is annotated as “Ras-associating” by PROSITE annotation rule PRU00166. In this work, we call this domain Rgl2RA. (B) Rgl2RA interacts with active KRas4BG12V. Bacteria recombinant Rgl2RA fragment spanning the amino acid residues 643–740 of Rgl2 was fused with GST, and the fusion protein was fixed on glutathione beads. Recombinant KRas4BG12V 1–169, loaded with either GDP or non-hydrolysable GTP analogue, GMPPNP, was applied on the beads to examine the protein–protein interaction. GST–Rgl2RA interacted only with the GMPPNP-loaded KRas4BG12V. (C) KRas4BG12V:Rgl2RA complex was purified using size exclusion chromatography. The fractions were analysed by SDS–PAGE gels (lower panel) according to the elution profile (upper panel). Fractions indicated by the green double-arrow line were used for crystallisation trials. (D, E) The size exclusion chromatography elution profiles of the KRas4B–Rgl2RA complex. Rgl2RA and KRas4BG12V (D) or KRas4BWT (E) were mixed at the 3:1 M ratio and applied to Superdex 75 10/300 Gl. The elution profiles (upper panels) show little difference between the two samples. Peak fractions were analysed by SDS–PAGE gel (lower panel).
Figure 1.
Figure 1.. KRas4BG12V exhibits a different binding kinetics towards Rgl2RA than KRas4BWT and is structurally more stable.
(A) KRas4BWT and KRas4BG12V samples used for biolayer interferometry (BLI) were confirmed to be loaded with GTP. The nucleotide-binding status of KRas4BWT and KRas4BG12V were examined by denaturating the proteins and detecting the released nucleotides by anion exchange chromatography. Samples of pure GDP or GTP were used as references. (B) KRas4BWT and KRas4BG12V show different binding kinetics towards Rgl2RA. BLI was used to measure the binding kinetics of KRas4B (analyte) to immobilized GST-Rgl2RA (ligand). GST-Rgl2RA was immobilized on the bio-sensors, and varying concentrations of free KRas4BWT (left panel) and KRas4BG12V (right panel) were provided, and the interactions were measured at 20°C. The 1:1 binding model was fitted to the data using Octet Analysis Studio 13.0 (Sartorius). The fitted curves are shown in red. The deduced KD values of these two cases are similar: ∼1.48 μM (WT) and 1.49 μM (G12V). Meanwhile, the kon values are ∼137 (M−1ms−1) (WT) and 238 (M−1ms−1) (G12V), and koff values are ∼0.20 (s−1) (WT) and 0.36 (s−1) (G12V), indicating that the G12V mutation may cause the interaction more dynamic. The high residual sum of squares value (90.5) for the wildtype case indicates that the 1:1 binding model fitting for the wildtype case is not as good as for the G12V case. (C) KRas4BWT and KRas4BG12V show highly similar binding kinetics towards BRAFRBD. (B) BLI was conducted in the same manner as (B), except using GST–BRAFRBD as the ligand. The 1:1 binding model fitting (shown in red) predicts the KD values of these two cases to be about 299 nM (WT) and 259 nM (G12V), respectively. The kon and koff values are comparable between the two cases, and the residual sum of squares values ensure the 1:1 binding model fitting is suitable for both the wildtype and the G12V cases. (D) KRas4BWT and KRas4BG12V samples used for circular dichroism (CD) were confirmed to be loaded with GTP. (A) The nucleotide-binding status of KRas4BWT and KRas4BG12V were examined in the same way as stated in (A). (E) CD spectra of KRas4BWT and KRas4BG12V (20 μM) at 20°C. (F) CD signal intensity at 220 nm as a function of temperature from 20°C to 90°C.
Figure 2.
Figure 2.. Crystal structure of the KRas4BG12V:Rgl2RA 2:2 heterotetramer.
Cartoon representation of the structure of the heterotetramer complex of KRas4BG12V and Rgl2RA with top view and side view; the two KRas4BG12V molecules are shown in dark and pale cyan and the two molecules of Rgl2RA in pink and violet. Switch I and switch II regions of KRas4BG12V are shown in green and yellow, respectively, and the α-helix and β-sheets are numbered for each chain. The Mg2+ is shown as a grey sphere. The structure shows that each KRas4BG12V molecule interacts with two Rgl2RA molecules (referred to as I and II) at switch I and switch II individually.
Figure S2.
Figure S2.. Analysis of KRas4B–effector binding kinetics.
(A, B) Analyses of binding kinetics of GST–Rgl2RA and KRas4BWT or KRas4BG12V. (A, B) The BLI sensorgram data presented in Fig 1B for the binding kinetics between Rgl2RA and KRas4BWT (A) or KRas4BG12V (B) were fitted for the 2:1 heterogeneous binding and the 1:2 bivalent binding models using Octet Analysis Studio 13.0 (Sartorius). The fitted curves are shown in red, and the deduced KD, kon, koff, and the residual sum of squares are shown below the sensorgrams. For the 2:1 heterogeneous binding model, the values for the two binding types (binding type 1 and 2) are shown. The proportions of each binding type (1 or 2) varied among the samples of different concentrations; hence, the varied percentage ranges are indicated. For the 1:2 bivalent binding model, the KRas4BG12V data could not be fitted. (C) Analyses of binding kinetics of GST–BRAFRBD and KRas4BWT or KRas4BG12V. The BLI sensorgram plots presented in Fig 1C were fitted for the 2:1 heterogeneous binding model using Octet Analysis Studio 13.0 (Sartorius). The fitted curves are shown in red, and the deduced KD, kon, koff, and residual sum of squares are shown below the sensorgrams. The proportion of each binding type (binding type 1 or 2) varied among the samples of different concentrations; hence, the varied percentage ranges are indicated.
Figure S3.
Figure S3.. KRas4BG12V:Rgl2RA complex is highly similar to HRasE31K:RALGDSRA complex.
(A) The structures of the KRas4BG12V:Rgl2RA complex and the HRasE31K:RALGDSRA complex (PDB: 1LFD) were superimposed by aligning the RA chains. (B, C) Superimposition of each corresponding chain of the KRas4BG12V:Rgl2RA complex and HRasE31K:RALGDSRA complex individually shows that each chain is similar to its respective counterpart structure. (B) KRas4BG12V and HRasE31K chains are in cyan and grey. (C) Rgl2RA and RALGDSRA are in purple and light pink. Amino acid sequence similarities of human Rgl2RA and rat RALGDSRA are shown below the RA cartoon representations, and the conserved amino acids in Rgl2RA and RALGDSRA are shaded in light green and dark green, respectively. The structural similarity between Rgl2RA and RALGDSRA was seen beyond the regions composed of the conserved amino acids. The RALGDSRA sequence is derived from PDB 1LFD, which is rat RALGDSRA, and the numbering was carried out according to UniProt Q03386. Root mean square deviation of atomic position values were generated using PyMol.
Figure 3.
Figure 3.. The interacting interface of KRas4BG12V and Rgl2RA of the KRas4BG12V:Rgl2RA 2:2 heterotetramer.
(A) The overview of the interacting interface of KRas4BG12V and Rgl2RA, highlighting the residues involved in hydrogen and hydrophobic interactions between β1, β2, and α1 of Rgl2RA1 (violet sticks) and KRas4BG12V switch I (green sticks, enlarged in the green box) or switch II (yellow sticks, enlarged in the yellow box). An orange dashed line shows a salt bridge formed between E37 of KRas4BG12V and R653 of Rgl2RA. (B) Upper panel: blow-up images of the KRas4BG12V:Rgl2RA interface involving switch I. Lower panel: a schematic representation of the intermolecular contacts where hydrogen bonds (green dashed lines), a salt bridge (orange dashed line), and hydrophobic contacts (spiked arches) were predicted by LIGPLOT (Wallace et al, 1995) (lower panel). Numbers indicate atomic distances in Å. (C) A blow-up image of the KRas4BG12V:Rgl2RA interface involving switch II (left panel) and its LIGPLOT representation (right panel).
Figure 4.
Figure 4.. The interacting interface of KRas4BG12V:KRas4BG12V and Rgl2RA:Rgl2RA of the KRas4BG12V:Rgl2RA 2:2 heterotetramer.
(A) The interface of KRas4BG12V:KRas4BG12V, highlighting the residues involved in hydrogen and hydrophobic interactions between two KRas4BG12V molecules. The interface comprises switch I, switch II, and α3 of the two KRas4BG12V molecules. The oncogenic mutation, V12, is annotated in red letters. A schematic representation of the intermolecular contacts predicted by LIGPLOT is presented in the right panel. (B) The interacting interface of Rgl2RA: Rgl2RA, highlighting the residues involved in hydrogen and hydrophobic interactions between two Rgl2RA molecules, shaded in pink and violet. The interaction occurs at the N-terminal between the two anti-parallel β1. A LIGPLOT diagram is shown below.
Figure S4.
Figure S4.. Schematic representation of the intermolecular contacts observed in the X-ray structure.
(A) The summary of the diagrams is presented in Fig 3. The residues in KRas4BG12V switch I region are shown in green, in the switch II region are shown in the yellow background, and those for Rgl2RA molecules 1 and 2 are shown in pink. V12 oncogenic mutation is in red. Hydrogen bonds, salt bridges, and hydrophobic interactions were predicted by LIGPLOT and represented by green dashed lines, solid orange lines, and blue dotted lines, respectively. (B) The electrostatic surface charge shows that the negatively charged switch I and switch II regions of KRas4BGV interact with the positively charged surface of Rgl2RA-1 and Rgl2RA-2. Surface charge potential was computed using the PyMol vacuum electrostatics function, and the negatively charged and positively charged areas are shown in red and blue, respectively.
Figure S5.
Figure S5.. KRas4BG12V:Rgl2RA complex formation in solution.
(A) Rgl2RA solution structure determined by NMR. The 2D 1H-15N-HSQC spectrum of the assigned residues of the Rgl2RA is shown (left). The Rgl2RA retains the ββαββαβ ubiquitin-fold structure (right). 20 Rgl2 NMR structures are superimposed. (B) Comparison between the human Rgl2RA and mouse RlfRA (PDB 1RLF) solution structures. Rgl2RA is presented in magenta, and 20 NMR structures are superimposed. RlfRA is in cyan, and 10 NMR structures are superimposed. The primary structures of the two constructs are listed below.
Figure 5.
Figure 5.. NMR analysis of KRas4BG12V:Rgl2RA complex formation in solution.
(A) Comparison between the Rgl2RA structures identified in solution NMR (shown in magenta) and in crystal complex with KRas4BG12V (shown in cyan). (B) 1H-15N HSQC titration analysis of 15N-labelled Rgl2RA upon addition of non-labelled KRas4BG12V. Overlays of 2D 1H-15N HSQC NMR spectra from multipoint titrations of 15N-labelled Rgl2RA with non-labelled KRas4BG12V. Rgl2RA:KRas4BG12V molar ratios of the titration samples are colour coded as follows; 1:0 – black, 1:0.25 – blue, 1:0.25 – cyan, 1:0.5 – green, 1:1 – yellow, 1:2 – orange, and 1:3 – red. (B, C) The NMR signal intensity changes (upper panel) and the chemical shift perturbation (lower panel) of backbone 1HN and 15N nuclei of Rgl2RA with non-labelled KRas4BG12V, presented in (B), are summarised as column diagrams as a function of Rgl2RA amino acid sequence. Proline and unassigned Rgl2RA residues are shaded in grey. Rgl2RA residues involved in the Rgl2RA:Rgl2RA interface of the KRas4BG12V:Rgl2RA crystal structure are highlighted in pink on the amino acid sequence, and residues involved in the KRas4BG12V:Rgl2RA interface are highlighted in blue. Rgl2RA residue position numbers, according to the UniProt, are indicated at the bottom of the diagram. (Upper panel) The signal intensities of Rgl2RA residues in the presence of three times molar excess of KRas4BG12V were divided by the signal intensities in the absence of KRas4BG12V and plotted as a bar chart graph. Red-dotted lines are drawn at the fold-change values of 0.5 and 1.5 to highlight the residues that show a substantial increase or decrease of the signals upon the addition of KRas4BG12V. (Lower panel) The chemical shift perturbation of backbone 1HN and 15N nuclei of Rgl2RA with non-labelled KRas4BG12V. The mean shift difference Δδave was calculated as ([Δδ1HN]2 + [Δδ15N/10]2)1/2 where Δδ1HN and Δδ15N are the chemical shift differences between Rgl2RA on its own and in the presence of non-labelled KRas4BG12V. The bar graphs are colour coded according to the Rgl2RA–KRas4BG12V concentration ratio.
Figure 6.
Figure 6.. KRas4BG12V:Rgl2RA complex formation in solution.
1H-15N-HSQC titration analysis of 15N-labelled KRas4BG12V upon addition of non-labelled Rgl2RA supports the KRas4BG12V:Rgl2RA tetramer formation. (A, B) The 2D 1H-15N-HSQC NMR spectra of KRas4BG12V. 15N-labelled KRas4BG12V was titrated with non-labelled Rgl2RA. (A) The 2D 1H-15N-HSQC spectra of KRas4BG12V: Rgl2RA complex mixed with the molar ratio of 1:0 (black, left panel) and 1:2 (red, right panel) are shown. Many signals from 15KRas4BG12V residues disappeared upon the addition of Rgl2RA. (B) Superimposed 2D 1H-15N-HSQC NMR spectra of 15N-labelled KRas4BG12V:Rgl2RA titration experiments. The titration samples are colour coded as follows; 1:0 – black, 1:0.25 – blue, 1:0. 5 – cyan, 1:0.75 –green, 1:1 – yellow, 1:1.5 – orange, and 1:2 – red. (C) Fold changes of the signal intensities of 15N-labelled KRas4BG12V upon the addition of non-labelled Rgl2RA. The signal intensities of KRas4BG12V residues in the presence of two times molar excess of Rgl2RA were divided by the signal intensities in the absence of Rgl2RA, and the obtained values were plotted as a column graph. Undetectable residues are shaded in grey. The residue T2 was also shaded grey, as the chemical shift after the addition of Rgl2RA overlapped with other signals. A red-dotted line is drawn at the fold-change values of 0.5 to indicate that most residues show a substantial decrease in the signals upon the addition of Rgl2RA. KRas4BG12V residues in the KRas4BG12V:KRas4BG12V interface of the KRas4BG12V:Rgl2RA crystal structure is highlighted in orange, and residues in the KRas4BG12V:Rgl2RA interface of the crystal structure is highlighted in blue. KRas4BG12V residue positions according to the UniProt are indicated at the bottom of the diagram.
Figure S6.
Figure S6.. Backbone resonance assignment of GDP-bound and GMPPNP-bound KRas4BG12V.
The 2D 1H-15N-HSQC spectra of GDP-bound and GMPPNP-bound KRas4BG12V. Cross peaks are labelled with their corresponding backbone assignments. Residues which could not be assigned are shaded in grey in the primary sequence shown at the bottom.
Figure S7.
Figure S7.. T1, T2, and {1H}-15N NOE for backbone 15N resonances of 15N-KRas4BG12V:Rgl2RA complex.
(A) The longitudinal relaxation times (T1), the transverse relaxation times (T2), and the steady-state heteronuclear {1H}-15N NOEs were measured using uniformly 2H/13C/15N-labeled KRas4BG12V with non-labelled Rgl2RA. Residues without data are shown in grey. (A, B) From the data presented in (A), the overall rotational correlation time τc, effective correlation times τe, and generalized order parameters S2 for each 15N–1H vector were estimated by a Lipari-Szabo model-free analysis. The deduced τc was ∼14.7 nsec. Meanwhile, theoretical τc values for a hypothetical dimer and a tetramer were calculated as follows. The two complex conformations were assumed to be spherical, and the radii of gyration were set to ∼25 and 35 Å, referring to the crystal structures of the heterodimer and the heterotetramer. By applying these values of radii to the Stokes–Einstein–Debye equation, the rotational correlation times for the hypothetical dimer and tetramer complexes were estimated to be ∼14.2 and 38.8 nsec, respectively.
Figure 7.
Figure 7.. KRas4BG12V:Rgl2RA complex can form a heterotetramer in solution.
Mass photometry analysis of KRas4BG12V:Rgl2RA complex in solution. (A) KRas4BG12V:Rgl2RA complex was purified using size exclusion chromatography. The fractions were analysed with 15% SDS–PAGE gel (upper panel) according to the elution profile (lower panel). Fraction 5 was chosen and measured using mass photometry (OneMP, Refeyn). (B) The cartoon representing the different complex configurations possibilities indicates that only heterodimers (∼31 kD) and heterotetramers (∼62 kD) can be detected by the system. Histogram of the frequency counts against the purified KRas4BGV:Rgl2RA complex with fitting for Gaussian distribution (red). The duration of the video analysed was 60 s, and it shows that the population identified has an average mass of ∼68 kD, which is in good agreement with the expected MW of the heterotetramer (61.7 kD). (C) KRas4BG12V and Halo-tagged Rgl2RA (Rgl2RA–Halo) complex formation. The cartoon represents MWs of possible complexes. KRas4BG12V and Rgl2RA–Halo were separately prepared and were mixed to generate a premix 2 μM sample, which was further diluted to 20, 50, 100, and 250 nM before the measurement. At 250 nM, Rgl2RA–Halo without KRas4BG12V showed about 55 kD, within the range of the predicted MW (∼46 kD). In contrast, the mixed samples showed an increase in the MW as the concentration was increased. At 50 nM, the observed MW was about 90 kD, which may represent the predicted dimer, and at 100–250 nM, the observed MW peaked at about 130 kD, which coincided with the predicted MW for the tetramer.
Figure S8.
Figure S8.. Comparison between KRas4BG12V:Rgl2RA switch I contact and KRaswt:CRAFRBD complex.
KRas4BG12V:Rgl2RA complex formed through KRas4B switch I region was compared with one of the representative Ras:RBD complexes, KRas4BWT:CRAFRBD complex (PDB: 6VJJ). Both structures show β2 helices of KRas4B and RA/RBD run parallel to create the interface of the complex. Meanwhile, regarding the spatial arrangements of the α1 of Ras and α1 of RA/RBD, the axes of KRas4BG12V α1 and Rgl2RA α1 cross at a wider angle than the axes of KRas4BWT α1 and CRAFRBD α1 do. This feature is shared among Ras:RalGDS-family complexes (Eves et al, 2022).
Figure S9.
Figure S9.. KRas4BG12V:Rgl2RA and HRasE31K:RALGDSRA complexes exhibit unique features among other Ras:effector complexes.
The KRas4BG12V:Rgl2RA complex was compared with representative Ras:effector complexes. The spectrum colour feature illustrates the orientation and ubiquitin super-fold status for one of the RA/RBD(s). When two RA/RBDs interact with one Ras molecule, the second RA/RBD is coloured pink (Rgl2RA) or blue (RALGDSRA). The KRas4BG12V in the Rgl2RA complex is in cyan, and other Ras molecules from previously published structures are in grey. The interacting residues involved in Ras switch II and RA/RBDs are depicted with magenta sticks and are labelled. (A) The two Ras:RalGEF complexes (KRas4BG12V:Rgl2RA complex and HRasE31K:RALGDSRA complex PDB:1LFD) show similar structural features, including the orientation of the RAs, the switch I contact and the mode of usage of switch II. Two RAs (RA-I in the spectrum colour and RA-II in either pink or in blue) interact separately with a single Ras molecule at switch I and switch II regions. (B) Examples of Ras:effector complex crystal structures. KRas4BWT:CRAFRBD complex (PDB: 6VJJ) shows that although Raf1RBD has similar orientations of the ubiquitin-fold structure to Rgl2RA-1, it does not use Ras switch II in complex formation. PI3KγRBD (PDB:1HE8) and PLCεRBD (PDB: 2C5L) complexed with Ras use switch II region differently to Ras:RalGEF complexes despite a similar orientation of the ubiquitin-fold structure of RA/RBDs. A single RBD interacts at both switch I and switch II regions of one Ras molecule. HRasD30E/E31K:RASSF5RA complex (3DDC) shows yet another unique interaction where the additional α-helix at the N-terminal of the RA/RBD interacts with the switch II region of the Ras molecule, instead of the RA/RBD region itself. Rgl1 is one of the RalGEFs, as Rgl2 and RALGDS are. However, unlike Rgl2 or RALGDS, KRas4BG12V:Rgl1RA complex (7SCX), and KRas4BWT:Rgl1RA complex (7SCW) show one Rgl1RA to interact with both switch I and switch II of one Ras molecule.
Figure S10.
Figure S10.. Rgl2RA primary structure is highly similar to RalGEFRA domains.
Multiple sequence alignment of Ras binding domain (RBD) of human CRAF (residues 56–131) and Ras association (RA) domains of human RalGEFs, RALGDS (residues 798–885), Rgl1 (residues 648–735), and Rgl2 (residues 648–735), as defined by UniProt. The alignment and the Clustal Omega guide tree (shown in a green-framed box) (Sievers et al, 2011), reveals that sequences are relatively divergent between CRAFRBD and RalGEF family RA domains, although all RBD/RA domains share the common ubiquitin-fold ββαββαβ structure. The RalGEF family RA domains share a high degree of sequence homology.
Figure S11.
Figure S11.. Heterotetramer formation in crystal structures of KRas4BG12V:Rgl2RA and HRasE31K:RALGDSRA complexes are distinct from the one in the KRas4BG12V:Rgl1RA complex.
Crystal structures of KRas4BG12V:Rgl2RA (this study), HRasE31K:RALGDSRA (PDB: 1LFD), and KRas4BG12V:Rgl1RA (PDB: 7SCX) are compared. All the Ras:RA heterodimers, formed through the Ras switch I region, show a highly similar structural arrangement (the top row). However, the way the second RA molecule interacts with the Ras:RA heterodimer in the KRas4BG12V:Rgl2RA is shared only with the HRasE31K:RALGDSRA complex (the second row). Consequently, the structural arrangements of the heterotetramers of KRas4BG12V:Rgl2RA and the HRasE31K:RALGDSRA crystal structures are distinct from the KRas4BG12V:Rgl1RA heterotetramer (third row). RA domains of these structures also clearly show that Rgl2RA and RALGDSRA are structurally different from Rgl1RA, which interacts with the second Rgl1RA through the C-terminal end (two bottom rows). The C-termini of the first RAs are shown in green.
Figure S12.
Figure S12.. Various Ras:Ras interfaces proposed by experimental and computational prediction studies.
The top panel shows the KRas4BG12V:KRas4BG12V interface of the KRas4BG12V:Rgl2RA heterotetramer complex (this study). The KRas4BG12V:KRas4BG12V contacts (shaded in purple) are located in loop regions of switch I, switch II, and α3. The KRas4BG12V:KRas4BG12V interface is distinct from previously proposed dimerization interfaces, which can be classified into four categories based on the relevant structural elements; α5–α4, α4–α3, α–β, and β–β. Example images for each category are shown. Single Ras molecules at the Ras:Ras interface are presented with the interacting residues highlighted in purple, and the involved α-helices and β-sheets are annotated. PDB IDs of the image templates are indicated next to each image. In the last example, the dimer formation was mediated by the β–β contact, aided by a small molecule inhibitor BI2852 (shown in purple). The Mg2+ is depicted as a dark grey sphere, and the bound nucleotide is shown as a ball-and-stick model.
Figure S13.
Figure S13.. The non-canonical Ras:Ras contact seen in three crystal structures, KRas4BG12V:Rgl2RA complex (this study), HRasE31K:RALGDSRA complex (PDB ID 1LFD), and HRasWT:HRasWT crystal structure (PDB ID 5P21).
Neighboring Ras molecules are shown to reveal comparable spatial arrangements. The side view (top panel), top view (middle panel), and the blow-up images of the area Y32 of RAS (bottom panel) are shown. Switch I and switch II regions are indicated in green and yellow. (A) KRas4BG12V:KRas4BG12V in the KRas4BG12V:Rgl2RA complex (this study). The two Rgl2RA domains are shown as a ribbon in light magenta. (B) HRasE31K:HRasE31K in the HRasE31K:RALGDSRA complex (PDB ID 1LFD). The two RALGDSRA domains are shown as a ribbon in light pink. (C) HRasWT:HRasWT in the HRasWT crystal (PDB ID 5P21). Spatial molecular arrangements around Y32 are similar in all the cases, but the oncogenic V12 provides a larger hydrophobic pocket, which may stabilise the KRas4BG12V:KRas4BG12V interface of the KRas4BG12V:Rgl2RA heterotetramer. (A, C) E31 of KRas4BG12V/HRasWT interact with KRas4BG12V/HRasWT K88. In (A), E31 of KRas4BG12V also interacts with Rgl2RA K685. (B) The hydrophobic pocket created by Y32 is not reinforced by G12, but K31 of HRasE31K interacts with rat RALGDSRA D815, N818, and D820 (the numbering was carried out according to UniProt Q03386), facilitating the complex formation.

References

    1. Andreadelis I, Kiriakidi S, Lamprakis C, Theodoropoulou A, Doerr S, Chatzigoulas A, Manchester J, Velez-Vega C, Duca JS, Cournia Z (2022) Membrane composition and Raf[CRD]-Membrane attachment are driving forces for K-Ras4B dimer stability. J Phys Chem B 126: 1504–1519. 10.1021/acs.jpcb.1c01184 - DOI - PubMed
    1. Apken LH, Oeckinghaus A (2021) The RAL signaling network: Cancer and beyond. Int Rev Cell Mol Biol 361: 21–105. 10.1016/bs.ircmb.2020.10.005 - DOI - PubMed
    1. Bollag G, McCormick F (1991) Differential regulation of rasGAP and neurofibromatosis gene product activities. Nature 351: 576–579. 10.1038/351576a0 - DOI - PubMed
    1. Boucher W (2010) Azara, v2.8. Available at: http://www.cambridge2000.com/azara/
    1. Bunney TD, Harris R, Gandarillas NL, Josephs MB, Roe SM, Sorli SC, Paterson HF, Rodrigues-Lima F, Esposito D, Ponting CP, et al. (2006) Structural and mechanistic insights into ras association domains of phospholipase C epsilon. Mol Cell 21: 495–507. 10.1016/j.molcel.2006.01.008 - DOI - PubMed

Publication types

Substances

LinkOut - more resources