

Structural insights into ClpP protease side exit pore-opening by a pH drop coupled with substrate hydrolysis
- PMID: 35593068
- PMCID: PMC9251834
- DOI: 10.15252/embj.2021109755
Structural insights into ClpP protease side exit pore-opening by a pH drop coupled with substrate hydrolysis
Abstract
The ClpP serine peptidase is a tetradecameric degradation molecular machine involved in many physiological processes. It becomes a competent ATP-dependent protease when coupled with Clp-ATPases. Small chemical compounds, acyldepsipeptides (ADEPs), are known to cause the dysregulation and activation of ClpP without ATPases and have potential as novel antibiotics. Previously, structural studies of ClpP from various species revealed its structural details, conformational changes, and activation mechanism. Although product release through side exit pores has been proposed, the detailed driving force for product release remains elusive. Herein, we report crystal structures of ClpP from Bacillus subtilis (BsClpP) in unforeseen ADEP-bound states. Cryo-electron microscopy structures of BsClpP revealed various conformational states under different pH conditions. To understand the conformational change required for product release, we investigated the relationship between substrate hydrolysis and the pH-lowering process. The production of hydrolyzed peptides from acidic and basic substrates by proteinase K and BsClpP lowered the pH values. Our data, together with those of previous findings, provide insight into the molecular mechanism of product release by the ClpP self-compartmentalizing protease.
Keywords: ClpP; acyldepsipeptide; cryo-EM; pH drop; protein degradation.
© 2022 The Authors.
Figures
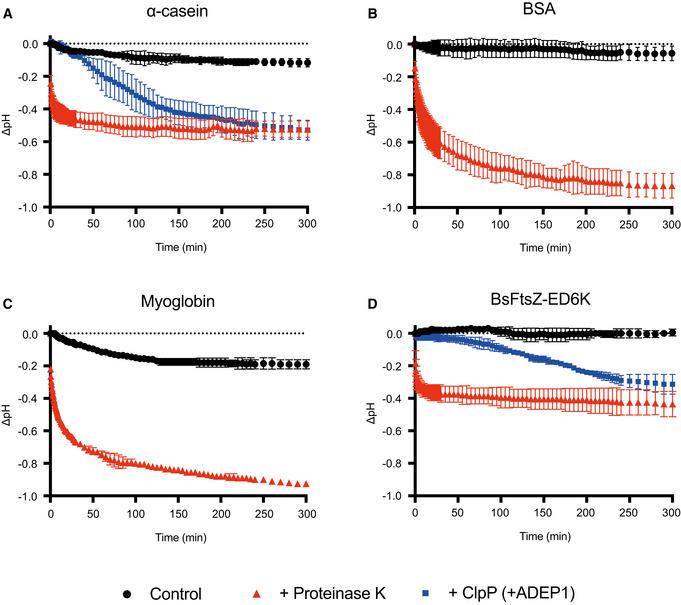
Monitoring of the pH change during the degradation of α‐casein by proteinase K and BsClpP in the presence of ADEP1.
Monitoring of the pH change during the degradation of bovine serum albumin (BSA) by proteinase K.
Monitoring of the pH change during the degradation of myoglobin by proteinase K.
Monitoring of the pH change during the degradation of the BsFtsZ‐ED6K mutant by proteinase K and BsClpP in the presence of ADEP1.
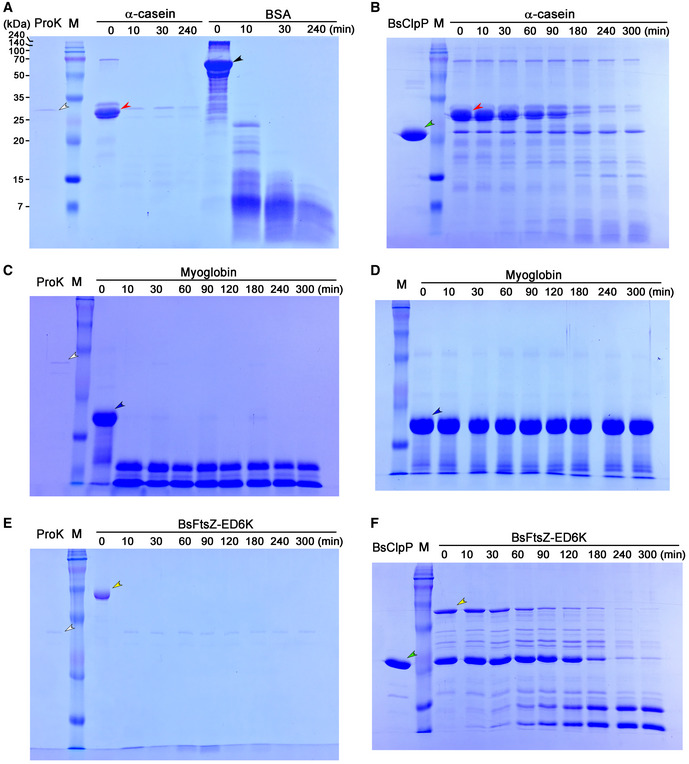
- A
Substrates α‐casein (red arrowhead) and bovine serum albumin (BSA: black arrowhead) were incubated with proteinase K (ProK: white arrowhead).
- B
Substrate α‐casein (red arrowhead) was incubated with BsClpP (green arrowhead) in the presence of ADEP1.
- C, D
Substrate myoglobin (blue arrowhead) was incubated with (C) and without proteinase K (white arrowhead) (D).
- E, F
Basic BsFtsZ‐ED6K substrate (yellow arrowhead) was incubated with proteinase K (white arrowhead) (E) and BsClpP (green arrowhead) + ADEP1 (F).
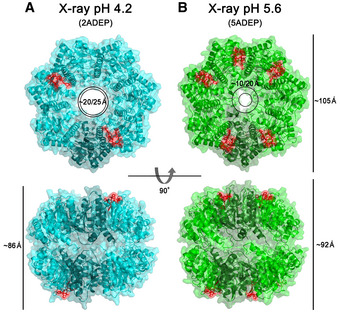
Ribbon diagram of 4 ADEP‐bound BsClpP (cyan) with a transparent molecular surface and one monomer in each heptameric ring, colored darker for clarity (2ADEP).
Ribbon diagram of 10 ADEP‐bound BsClpP (green) with a transparent molecular surface and one monomer in each heptameric ring, colored darker for clarity (5ADEP). Tetradecameric BsClpP is viewed along a 7‐fold molecular symmetry axis (upper), and the 2‐fold side view is observed by rotating 90° (lower). The bound ADEP molecules colored red are shown as stick models. The dimensions of the models are indicated. Two diameters are noted due to the asymmetric shape of the entrance pore.
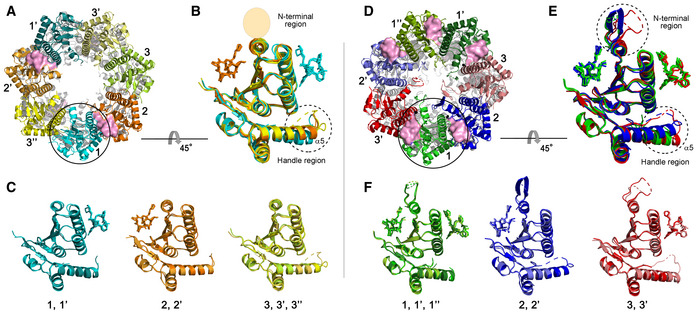
Three different subunit environments of 2ADEP viewed along a 7‐fold axis: two cyanish subunits (1 and 1′) with the bound ADEP (pink molecular surface) on the right side, two orangish subunits (2 and 2′) with the bound ADEP on the left side, and three yellowish subunits (3, 3′ and 3′′) with no ADEP molecule.
Superposition of all 7 subunits in the heptameric ring of 2ADEP viewed by rotating panel (A) 45° about the horizontal axis. The invisible N‐terminal region, due to flexibility, is marked with a transparent oval, and the structurally dynamic handle region is marked with a dashed circle.
Superposition of cyanish subunits (1, 1′), orangish subunits (2, 2′), and yellowish subunits (3, 3′, 3′′). The view is the same as that of panel (B).
Three different subunit environments of 5ADEP viewed along a 7‐fold axis: three greenish subunits (1, 1′ and 1′′) with the bound ADEP (pink molecular surface) on both the left and right sides, two bluish subunits (2 and 2′) with the bound ADEP on the left side, and two reddish subunits (3 and 3′) with the bound ADEP on the right side.
Superposition of all 7 subunits in the heptameric ring of 5ADEP viewed by rotating panel (D) 45° about the horizontal axis. The very flexible N‐terminal region and handle region are marked with dashed circles.
Superposition of greenish subunits (1, 1′, 1′′), bluish subunits (2, 2′), and reddish subunits (3, 3′). The view is the same as that of panel (E).
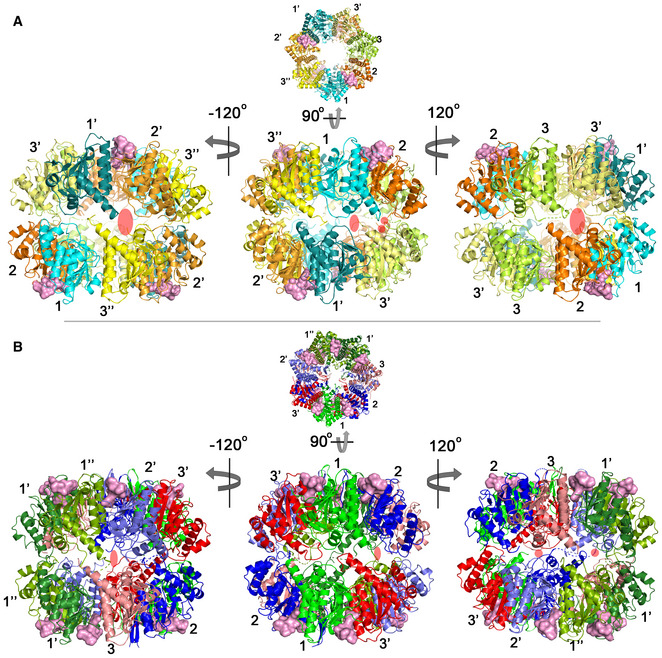
Side view of the 2ADEP structure obtained by rotating the top view (Fig 3A) 90° about the horizontal axis (middle). Left and right, approximately 120° (counterclockwise (−) and clockwise (+)) rotation along the vertical axis showing asymmetric side pores. The side exit pores are marked with transparent red ovals. The colors and numbers indicating the subunit environments are the same as those in Fig 3A.
Side view of the 5ADEP structure obtained by rotating the top view (Fig 3D) 90° about the horizontal axis (middle). Left and right, the view is the same as that of panel (A). The colors and numbers indicating the subunit environments are the same as those in Fig 3D.
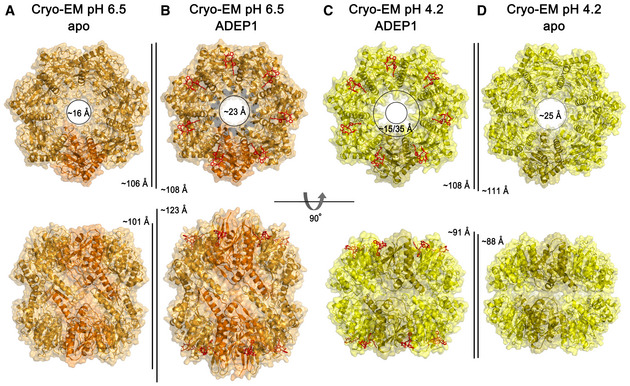
Ribbon diagram, with the transparent molecular surface of the extended apo‐BsClpP structure at pH 6.5 viewed along a 7‐fold molecular symmetry axis (upper row) and viewed with 90° rotation to display the side view of the 2‐fold symmetry axis (lower row). One monomer is shown in darker orange color for clarity.
Same representation as that of panel (A) showing the 14 ADEP1‐bound BsClpP at pH 6.5. The bound ADEP1 molecules are shown as stick models colored red.
Same representation as that of the compressed BsClpP with 14 ADEP1 molecules at pH 4.2. One monomer is shown in darker yellow color for clarity.
Same representation as that of the compressed apo‐BsClpP at pH 4.2. The dimensions of the models are indicated.
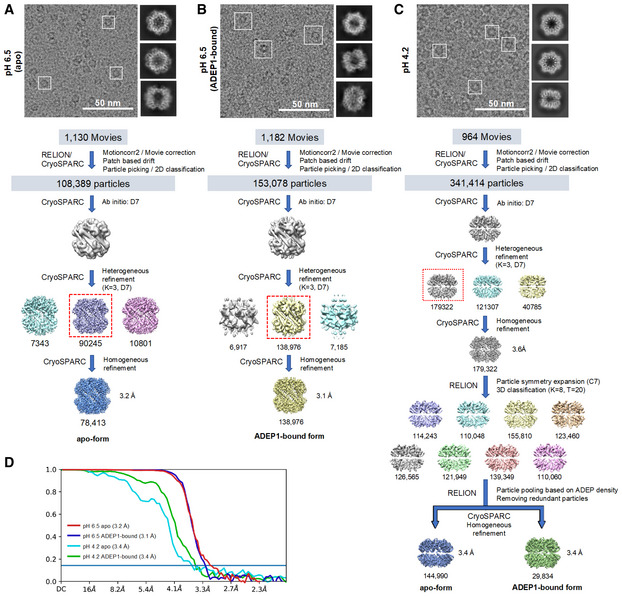
- A–C
Representative electron micrograph, 3‐D classification and map refinement workflow of the apo form of BsClpP at pH 6.5 (A), 14 ADEP‐bound form of BsClpP at pH 6.5 (B), and apo and 14 ADEP‐bound forms of BsClpP at pH 4.2 (C).
- D
Map resolution for each BsClpP cryo‐EM structure according to the gold‐standard Fourier shell correlation (FSC) at the 0.143 criterion.
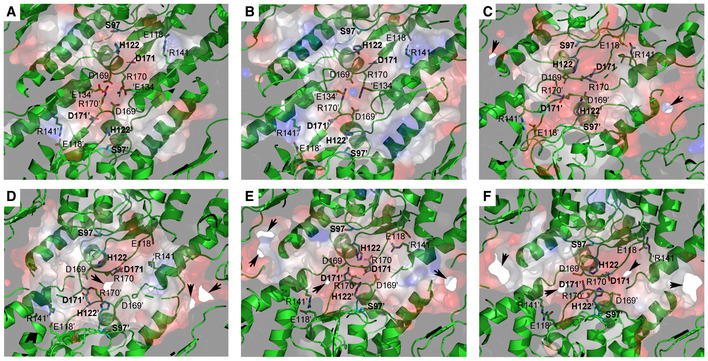
Ribbon diagram, with the transparent electrostatic potential surface of the extended apo‐BsClpP viewed from the center of the proteolytic chamber. The catalytic triad (S97‐H122‐D171) is shown in the fully active configuration.
Same representation for the 14 ADEP‐bound BsClpP cryo‐EM structure at pH 6.5. The residues maintaining the extended conformation are now slightly loosened, and the catalytic triad is slightly distorted.
Same representation for the 14 ADEP‐bound BsClpP at pH 4.2. The conformation is now compact, and side exit pores (black arrows) start to appear.
Same representation for 5ADEP at pH 5.6. The conformation of BsClpP is compact, and the catalytic triads in the upper and lower heptameric rings become closer and exhibit an inactive configuration.
Same representation for 2ADEP at pH 4.2. The conformation of BsClpP is compressed, and the catalytic triads in the upper and lower heptameric rings are very close.
Same representation for the compressed apo‐BsClpP. The exit pores are wide open for product release.
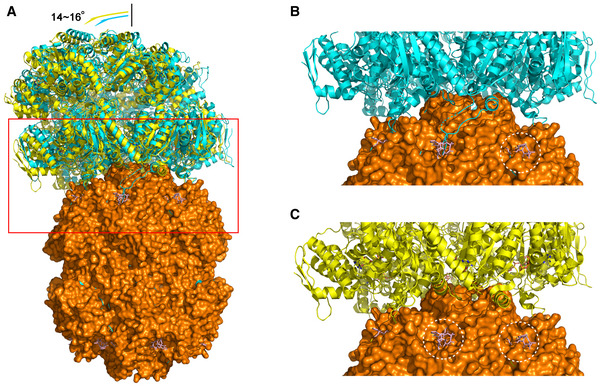
Overall view of two conformations (6W21 in cyan and 6W20 in yellow) of the E. coli ClpAP complex. The ClpAP complex was superimposed with BsClpP at pH 6.5 (orange) complexed with ADEP (pink). The red boxed region indicates the interaction region between ClpP and the activators ClpA or ADEP.
Six IGL loops of ClpA overlap with the ADEP molecules, and thus, only one site of ClpP is empty in this conformation of the ClpAP complex (cyan). Enlarged view of the red boxed region in (A).
Only five IGL loops of ClpA overlap with the ADEP molecules; thus, two sites of ClpP are empty in this conformation of the ClpAP complex (yellow). The binding sites left empty by ClpAP are marked with white dotted circles in ClpAP, whereas ADEP occupies these sites in the ADEP‐BsClpP structure. The conformation of ClpAP in panel (C) shows slightly more tilted angles (14 versus 16°), as shown in panel (A) (Lopez et al, 2020). Enlarged view of the red boxed region in (A).
References
-
- Brötz‐Oesterhelt H, Beyer D, Kroll H‐P, Endermann R, Ladel C, Schroeder W, Hinzen B, Raddatz S, Paulsen H, Henninger K et al (2005) Dysregulation of bacterial proteolytic machinery by a new class of antibiotics. Nat Med 11: 1082–1087 - PubMed
Publication types
MeSH terms
Substances
Associated data
- Actions
- Actions
- Actions
- Actions
- Actions
- Actions
LinkOut - more resources
Full Text Sources
Miscellaneous
