

NeutrobodyPlex-monitoring SARS-CoV-2 neutralizing immune responses using nanobodies
- PMID: 33904225
- PMCID: PMC8097376
- DOI: 10.15252/embr.202052325
NeutrobodyPlex-monitoring SARS-CoV-2 neutralizing immune responses using nanobodies
Abstract
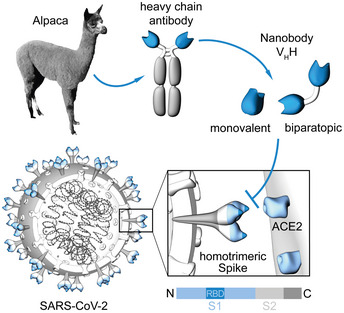
In light of the COVID-19 pandemic, there is an ongoing need for diagnostic tools to monitor the immune status of large patient cohorts and the effectiveness of vaccination campaigns. Here, we present 11 unique nanobodies (Nbs) specific for the SARS-CoV-2 spike receptor-binding domain (RBD), of which 8 Nbs potently inhibit the interaction of RBD with angiotensin-converting enzyme 2 (ACE2) as the major viral docking site. Following detailed epitope mapping and structural analysis, we select two inhibitory Nbs, one of which binds an epitope inside and one of which binds an epitope outside the RBD:ACE2 interface. Based on these, we generate a biparatopic nanobody (bipNb) with viral neutralization efficacy in the picomolar range. Using bipNb as a surrogate, we establish a competitive multiplex binding assay ("NeutrobodyPlex") for detailed analysis of the presence and performance of neutralizing RBD-binding antibodies in serum of convalescent or vaccinated patients. We demonstrate that NeutrobodyPlex enables high-throughput screening and detailed analysis of neutralizing immune responses in infected or vaccinated individuals, to monitor immune status or to guide vaccine design.
Keywords: SARS-CoV-2; immune response; nanobodies; neutralizing antibodies; serological assay.
©2021 The Authors. Published under the terms of the CC BY 4.0 license.
Conflict of interest statement
T.R.W., P.K., N.S.M., and U.R. are named as inventors on a patent application (EP 20 197 031.6) claiming the use of the described Nanobodies for diagnosis and therapeutics filed by the Natural and Medical Sciences Institute. The other authors declare no competing interest.
Figures
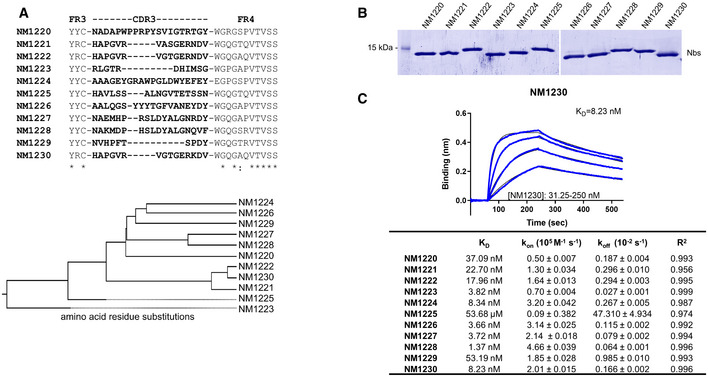
Amino acid sequences of the complementarity determining region (CDR) 3 from unique Nbs selected after two rounds of biopanning are listed (upper panel). Phylogenetic tree based on a ClustalW alignment of the Nb sequences is shown (lower panel).
Recombinant expression and purification of Nbs using immobilized metal affinity chromatography (IMAC) and size exclusion chromatography (SEC). Coomassie staining of 2 µg of purified Nbs is shown.
For biolayer interferometry (BLI)‐based affinity measurements, biotinylated RBD was immobilized on streptavidin biosensors. Kinetic measurements were performed by using four concentrations of purified Nbs ranging from 15.6 nM to 2 µM. As an example, the sensogram of NM1230 at indicated concentrations is shown (upper panel). The table summarizes affinities (K D), association (k on), and dissociation constants (k off) determined for individual Nbs (lower panel).
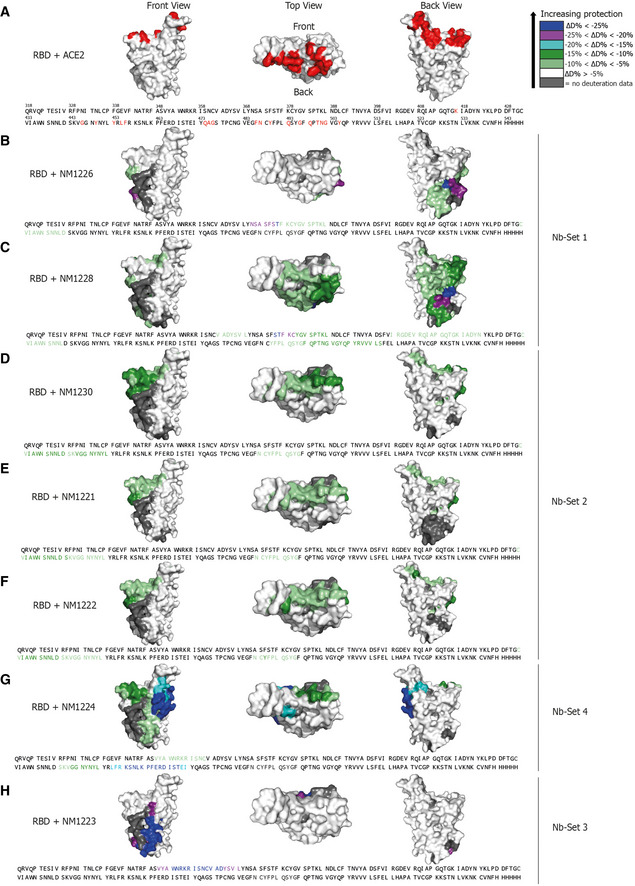
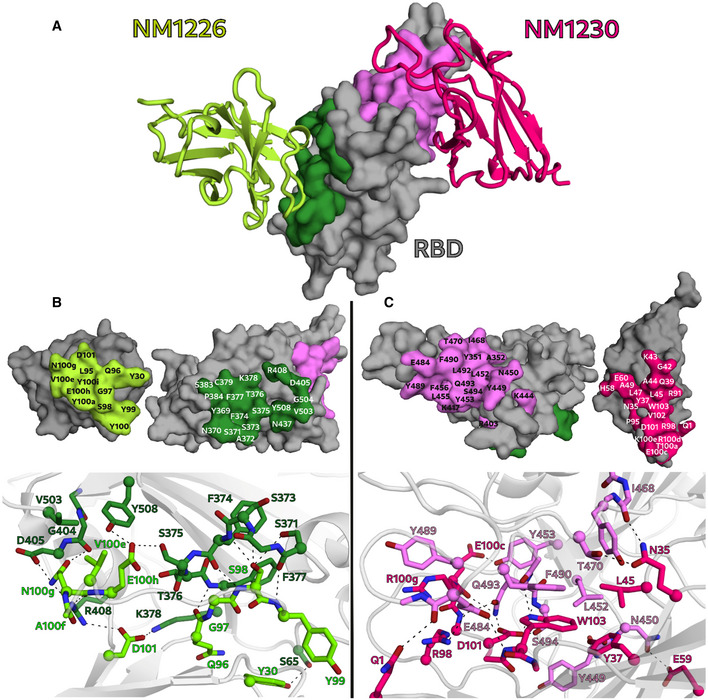
Numbered amino acid residues of RBD (pdb code: 6M17 (Yan et al, 2020)) involved in the RBD:ACE2 interaction site (Lan et al, 2020; Yan et al, 2020) are shown in red.
NM1226 (Nb‐Set1)
NM1228 (Nb‐Set1)
NM1230 (Nb‐Set2)
NM1221 (Nb‐Set2)
NM1222 (Nb‐Set2)
NM1224 (Nb‐Set4)
NM1223 (Nb‐Set3)
- A
Overview of the binding epitopes of NM1226 (light green) on RBD (dark green) and NM1230 (magenta) on RBD (light pink), respectively.
- B, C
The binding interfaces of NM1226 (B) and NM1230 (C) with the RBD are shown as surface representation (upper panels) and in a close‐up view as balls and sticks with direct hydrogen bonds and salt bridges indicated as dotted lines (lower panels). All residues involved in contact formation at a distance cutoff of < 4 Å are listed and labeled. A close‐up view of both interfaces reports a detailed interaction map of both contact areas.
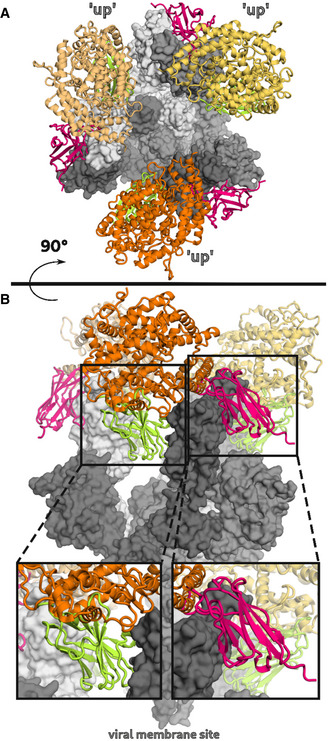
- A, B
(A) Top and (B) side view of the SARS‐CoV‐2 spike protein (gray) in complex with the ACE2 receptor (yellow, orange, dark orange) (pdb code: 7KMS) superposed on the RBD:Nb complexes NM1226 (light green) and NM1230 (magenta). A close‐up view shown in black boxes elucidates how both Nbs block ACE2 receptor attachment.
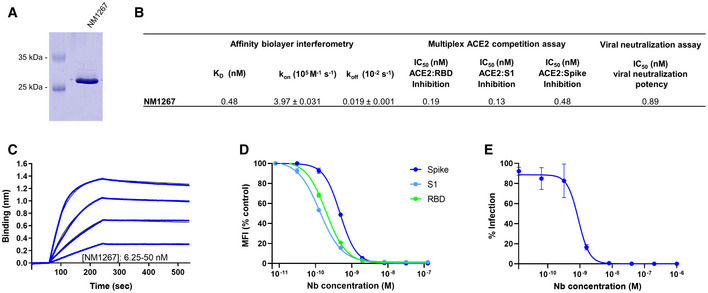
Coomassie staining of 1 µg of purified biparatopic Nb NM1267.
Table summarizing the affinity (K D), association (k on), and dissociation constants (k off) determined by BLI and IC50 values of the multiplex ACE2 competition assay and virus neutralization assay obtained for NM1267.
Sensogram of affinity measurements via BLI using four concentrations (6.25–50 nM) of NM1267.
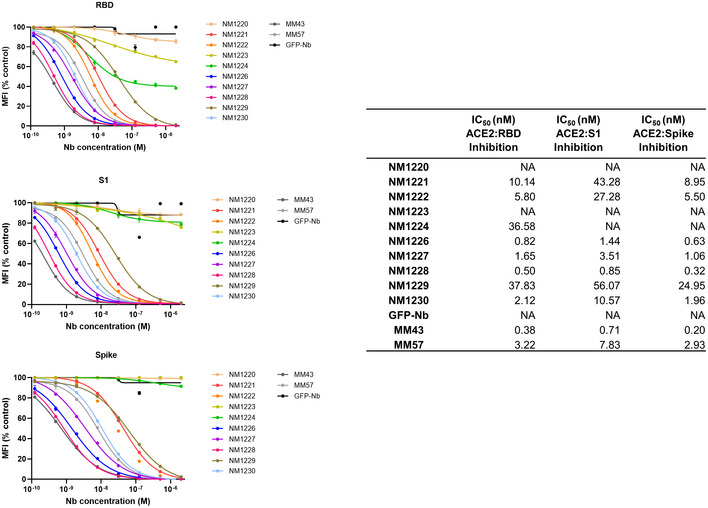
Results from multiplex ACE2 competition assay are shown for the three spike‐derived antigens: RBD, S1‐domain (S1), and homotrimeric spike (Spike). Color‐coded beads coated with the respective antigens were co‐incubated with biotinylated ACE2 and dilution series of NM1267 (8 pM to 126 nM) followed by measuring residual binding of ACE2. MFI signals were normalized to the maximum detectable signal per antigen given by the ACE2‐only control. IC50 values were calculated from a four‐parametric sigmoidal model. Data are presented as mean ± s.d. of three technical replicates.
Neutralization potency of NM1267 was analyzed in Caco‐2 cells using the SARS‐CoV‐2‐mNG infectious clones. Infection rate normalized to virus‐only infection control is illustrated as percent of infection (% Infection). IC50 value was calculated from a four‐parametric sigmoidal model, and data are presented as mean ± s.e.m. of three biological replicates (n = 3).
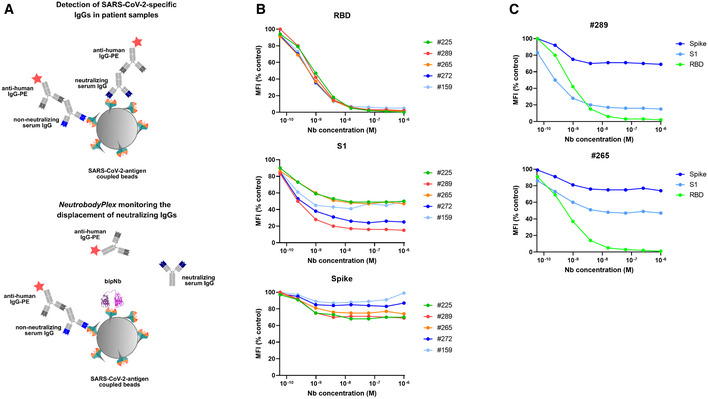
Schematic illustration of the NeutrobodyPlex. The displacement of serum‐derived neutralizing IgGs binding to SARS‐CoV‐2 antigens upon addition of bipNb is measured. In presence of neutralizing IgGs, the fluorescent signal from anti‐human‐IgG‐PE is inversely proportional to the applied bipNb concentration.
For the NeutrobodyPlex, antigen‐coated beads comprising RBD, S1, or spike were co‐incubated with serum samples from five patients and a dilution series of NM1267 (1 µM to 6 pM) (n = 1). Mean fluorescent intensities (MFI) derived from antigen‐bound IgGs in the presence of bipNb normalized to the MFI values of IgGs in the serum‐only samples, illustrated as MFI (% control), are shown.
For two patient‐derived serum samples (#289, #265), differences in the NM1267‐mediated displacement of IgGs binding the three spike‐derived antigens (RBD, S1, spike) are shown.
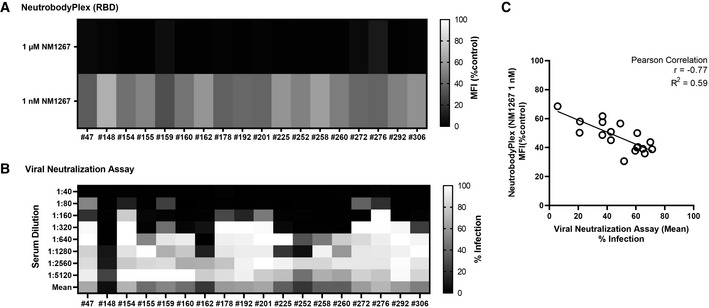
For the NeutrobodyPlex on RBD, two concentrations of NM1267 (1 µM and 1 nM) were applied (n = 1). Light colored squares (high MFI (%control)) are indicative for IgGs outcompeting NM1267 from the RBD:ACE2 interface; dark colored squares (low MFI (%control)) show a continuous displacement of IgGs from serum samples in the presence of NM1267.
For the virus neutralization assay, serial dilutions of the serum samples (1:40 – 1:5,120) were applied (n = 1). Dark colored squares are indicative for a low infection level (low % Infection); light colored squares show a high infection rate (high % Infection).
The mean percent of infection (% Infection) derived from all individual serum dilutions obtained by the virus neutralization assay was calculated and plotted against the respective MFI (% control) obtained from the NeutrobodyPlex on RBD in the presence of NM1267 (1 nM). The Pearson correlation determined a negative correlation with r = −0.77 and R 2 = 0.59 (P < 0.05).
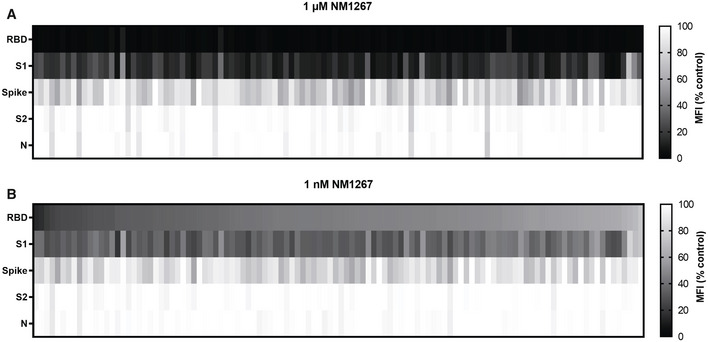
NeutrobodyPlex NM1267 1 µM.
NeutrobodyPlex NM1267 1 nM.
- A, B
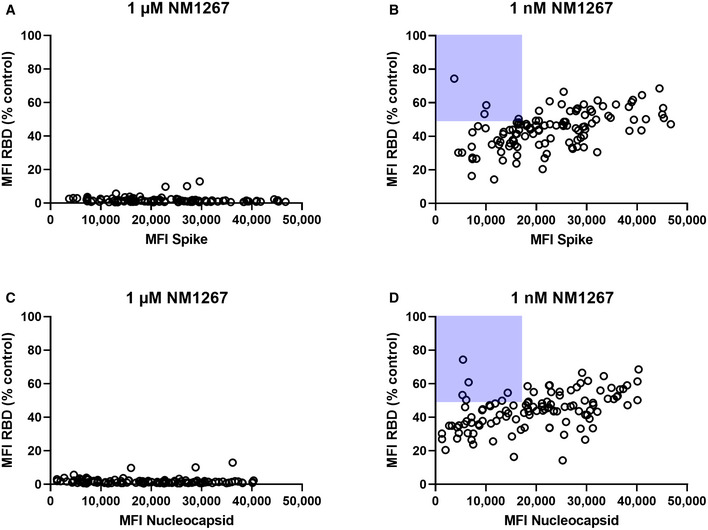
Total IgGs derived from spike‐binding IgGs were plotted against normalized MFI values from IgGs binding to RBD (MFI RBD (%control)) in the presence of both concentrations of NM1267 (1 µM; 1 nM).
- C, D
Total IgGs derived from N‐binding IgGs were plotted against normalized MFI values from IgGs binding to RBD (MFI RBD (%control)) in the presence of both concentrations of NM1267 (1 µM; 1 nM).
References
-
- Arbabi Ghahroudi M, Desmyter A, Wyns L, Hamers R, Muyldermans S (1997) Selection and identification of single domain antibody fragments from camel heavy‐chain antibodies. FEBS Lett 414: 521–526 - PubMed
Publication types
MeSH terms
Substances
Associated data
- Actions
- Actions
Grants and funding
LinkOut - more resources
Full Text Sources
Other Literature Sources
Medical
Molecular Biology Databases
Research Materials
Miscellaneous
