. 2024 Oct 7;15(1):8574.
doi: 10.1038/s41467-024-52808-2.

Structural basis for receptor-binding domain mobility of the spike in SARS-CoV-2 BA.2.86 and JN.1

Collaborators, Affiliations

Structural basis for receptor-binding domain mobility of the spike in SARS-CoV-2 BA.2.86 and JN.1

Hisano Yajima et al. Nat Commun. .

Abstract

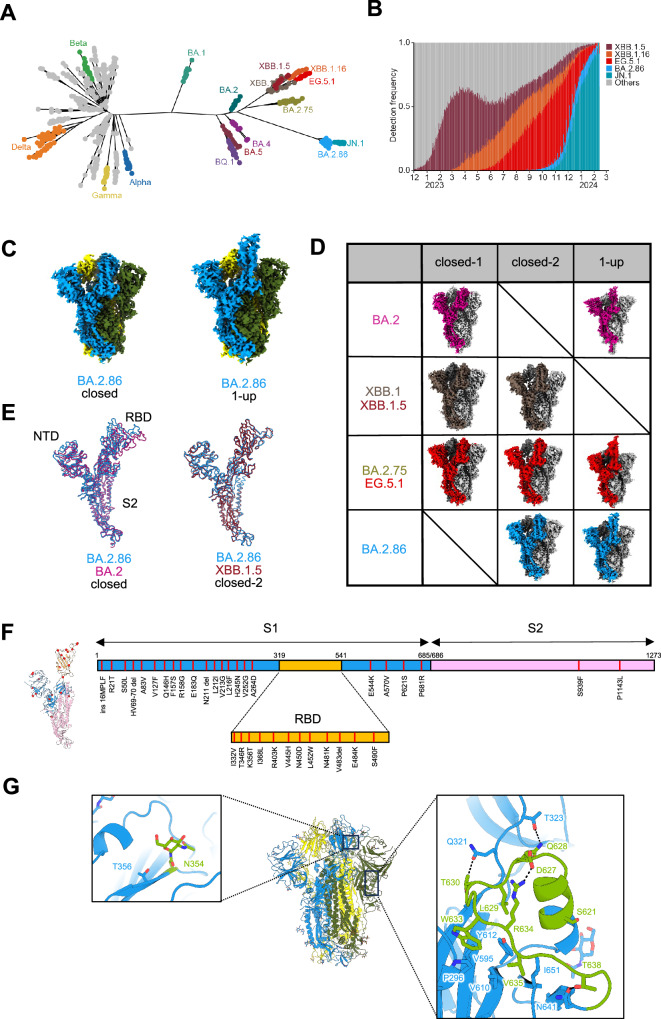
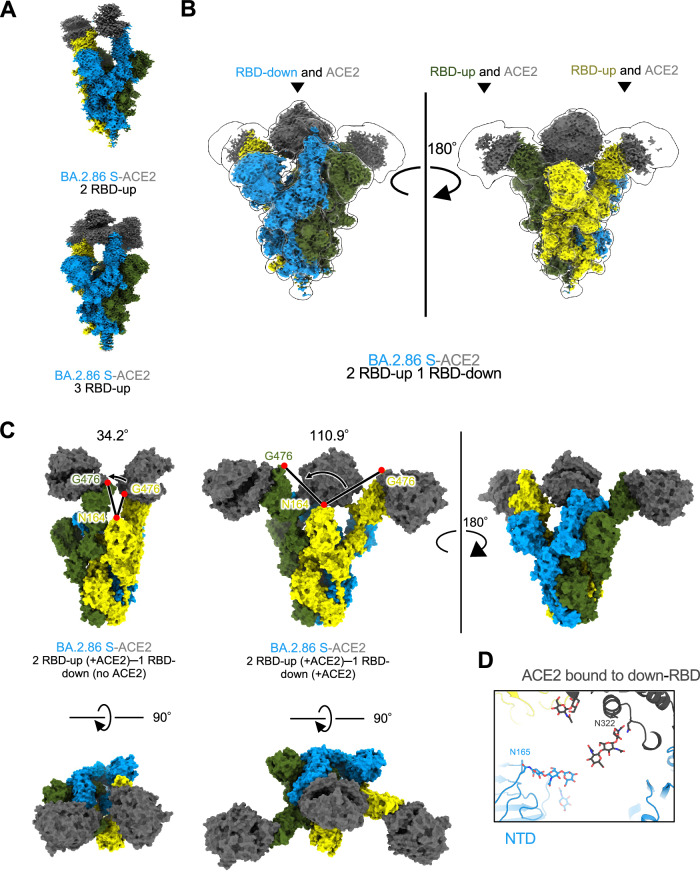
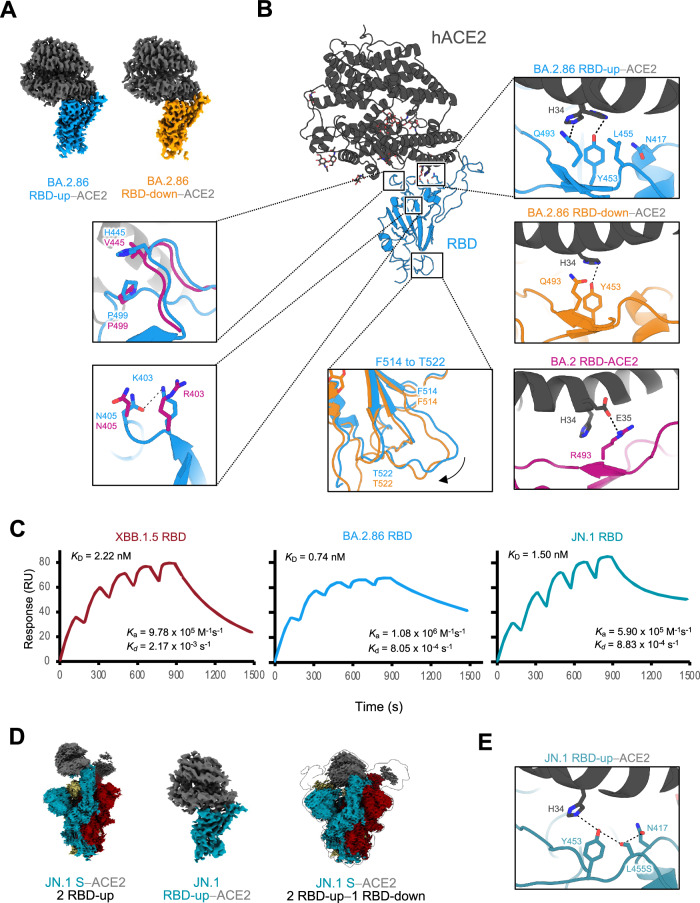
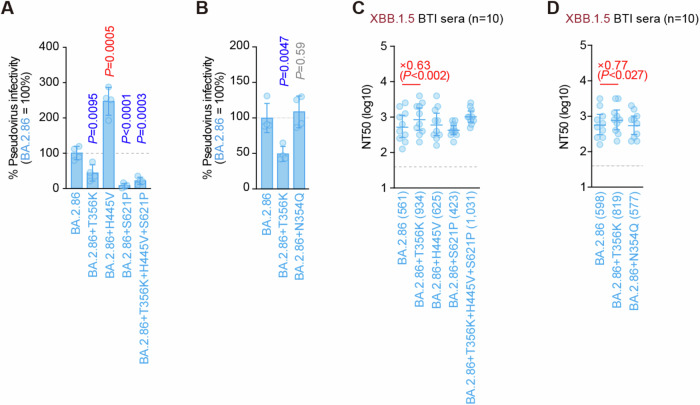
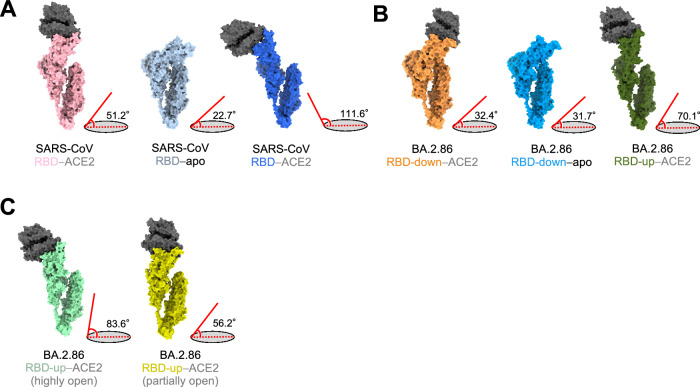
Since 2019, SARS-CoV-2 has undergone mutations, resulting in pandemic and epidemic waves. The SARS-CoV-2 spike protein, crucial for cellular entry, binds to the ACE2 receptor exclusively when its receptor-binding domain (RBD) adopts the up-conformation. However, whether ACE2 also interacts with the RBD in the down-conformation to facilitate the conformational shift to RBD-up remains unclear. Herein, we present the structures of the BA.2.86 and the JN.1 spike proteins bound to ACE2. Notably, we successfully observed the ACE2-bound down-RBD, indicating an intermediate structure before the RBD-up conformation. The wider and mobile angle of RBDs in the up-state provides space for ACE2 to interact with the down-RBD, facilitating the transition to the RBD-up state. The K356T, but not N354-linked glycan, contributes to both of infectivity and neutralizing-antibody evasion in BA.2.86. These structural insights the spike-protein dynamics would help understand the mechanisms underlying SARS-CoV-2 infection and its neutralization.


Conflict of interest statement

The authors declare no competing interests.

Figures

Fig. 1
Fig. 1. Evolutionary and epidemic features of BA.2.86 and cryo-EM maps of BA.2.86-S-protein.
A Maximum likelihood tree depicting SARS-CoV-2 evolution. B Detection frequency plot of XB.1.5, XBB.1.6, EG.5.1, BA.2.86, JN.1, and other variants. C Cryo-EM maps of the BA.2.86-S-protein trimer, closed-2 state (left) and one-RBD-up state (right); protomers are sky blue, yellow, and dark olive green. D Cryo-EM maps obtained for each Omicron subvariants. Protomers for BA.2, XBB.1/XBB.1.5, BA.2.75/EG.5.1, and BA.2.86 are shown in dark green, brown, red, and sky blue, respectively. Other protomers are shown in dark gray and light gray. E Superposition of the main-chain structure as protomers of the BA.2.86-S closed-2 state (sky blue), BA.2-S closed-1 state (deep pink), and XBB.1.5-S closed-2 state (raspberry), respectively. F The position of amino-acid substitutions in the BA.2.86-S-protein compared to the XBB.1.5-S-protein. The BA.2.86-S protomer structure (left) and its sequence schematic (right) are shown as the S1 subunit (sky blue), the S2 subunit (pink), and the RBD (bright yellow). G Structure of BA.2.86-S-protein trimer (same colors as in C); close-up view presents the N354-linked glycan (left) and residues 621–640 (right), showing interactions with surrounding residues and glycosylation sites as sticks (leaf green). Dashed lines represent hydrogen bonds.
Fig. 2
Fig. 2. Cryo-EM maps of BA.2.86-S-protein bound to ACE2.
A–C Cryo-EM maps of BA.2.86-S-protein bound to human ACE2 (S; same colors as Fig. 1C, ACE2; dark gray). A Two-RBD-up state (top), and three-RBD-up state (bottom). B Two-RBD-up−one-RBD-downthree-ACE2 state. C Comparison of the angles formed by the three residues: N164 of the NTD and two G476 of the up-RBD for two-RBD-uptwo-ACE2 (34.2°, left) and two-RBD-up−one-RBD-downthree-ACE2 (110.9°, right), respectively. D Close-up view of the two-RBD-up−one-RBD-downthree-ACE2 state. The N165-linked glycan in the NTD and the N322-linked glycan in ACE2 are situated close to each other.
Fig. 3
Fig. 3. Structures of RBD-ACE2 complexes in the BA.2.86- and JN.1-S- proteins, and binding affinities to ACE2 in the XBB.1.5, BA.2.86, and JN.1.
A Cryo-EM maps of the RBD–ACE2 interface in the RBD-up (sky blue)−ACE2 (dark gray), and RBD-down (orange)−ACE2. B Structure of BA.2.86 S RBD-ACE2 complex (same colors as in A). Close-up views represent residues involved in the corresponding interaction of the BA.2.86 RBD-up–ACE2 complex structure, which differs from the BA.2 or BA.2.86 RBD-down–ACE2 complex structure (BA.2; PDB, 8DM6; BA.2 RBD, deep pink; ACE2, dark gray, BA.2.86 RBD-down; same color as A), are shown. Dashed lines represent hydrogen bonds. C Sensorgrams of SPR analysis evaluating the binding affinities of ACE2 for BA.2.86 S-RBD (sky blue), JN.1 S-RBD (blue-green), and XBB.1.5 S- RBD (raspberry). D Cryo-EM maps of JN.1-S-protein bound to human ACE2 (S; blue-green, raspberry and khaki, ACE2; dark gray). The two-RBD-uptwo-ACE2 state (left), the RBD-ACE2 interface in the RBD-up−ACE2 (middle), and the two-RBD-up−one-RBD-downthree-ACE2 state (right). E Close-up view of the JN.1 S–ACE2 interface (JN.1 S; blue-green, ACE2; dark gray). Dashed lines represent hydrogen bonds.
Fig. 4
Fig. 4. Effects of amino acid substitution on BA.2.86 infectivity and immune evasion.
A, B Lentivirus-based pseudovirus assay. HOS-ACE2/TMPRSS2 cells were infected with pseudoviruses bearing each S-protein of BA.2.86 and its derivatives. The amount of input virus was normalized to that of HIV-1 p24 capsid protein. The percent infectivity of BA.2.86 derivatives compared to that of BA.2.86 is shown. The horizontal dashed line indicates the mean value of the percentage infectivity of BA.2.86. Assays were performed in quadruplicate, and a representative result of four independent assays is shown. Data are presented as the mean ± SD. Each dot indicates the result of an individual replicate. Statistically significant differences versus BA.2.86 are determined by two-sided Student’s t tests. The p values for the difference of each infectivity are indicated in A (vs BA.2.86 + T356K, p = 0.0095; vs BA.2.86 + H445V, p = 0.0005; vs BA.2.86 + S621P, p < 0.0001; and vs BA.2.86 + T356K + H445V + S621P, p = 0.0003) and in (B) (vs BA.2.86 + T356K, p = 0.0047 and vs BA.2.86 + N354Q, p = 0.59). Increased and decreased infectivity are shown in red and blue, respectively. C, D Neutralization assay. Assays were performed with pseudoviruses harboring the S-proteins of BA.2.86 and its derivatives. Convalescent sera were used, which were from fully vaccinated individuals who had been infected with XBB.1.5 (four 3-dose vaccinated, three 4-dose vaccinated, two 5-dose vaccinated, and one 6-dose vaccinated; total =10 donors). Assays for each serum sample were performed in quadruplicate to determine the 50% neutralization titer (NT50). Each dot represents one NT50 value, and the geometric mean and 95% confidence interval are shown. Numbers in parentheses indicates the geometric mean of NT50 values. The horizontal dashed line indicates the detection limit (40-fold). Statistically significant differences vs. BA.2.86 were determined by two-sided Wilcoxon signed-rank tests. The p-values less than 0.05 for the difference of each NT50 are indicated in C (vs BA.2.86 + T356K, p = 0.0020; vs BA.2.86 + H445V, p = 0.22; vs BA.2.86 + S621P, p = 0.32; and vs BA.2.86 + T356K + H445V + S621P, p = 0.10) and in D (vs BA.2.86 + T356K, p = 0.027 and vs BA.2.86 + N354Q, p = 0.77). NT50 fold changes compared with BA.2.86 are indicated by X.
Fig. 5
Fig. 5. Comparisons of the angles between RBDs and the horizontal plane.
A–C Protomer of S-proteins in SARS-CoV and SARS-CoV-2 BA.2.86 S─ACE2 complex. Angles between the axis of RBDs in the SARS-CoV-2 BA.2.86 or SARS-CoV and the horizontal plane are shown to the right of each conformation. A Surfaces of SARS-CoV S─ACE2 complex. Left: ACE2-bound conformation 1 (S; light pink). Middle: Unbound-down conformation (S; blue gray). Right: ACE2-bound conformation 3 (S; blue). B Surfaces of BA.2.86 S–ACE2 complex. Left: RBD-down–ACE2 conformation (S; orange). Middle: RBD-down conformation in the apo form (S; sky blue). Right: RBD-up–ACE2 (S; dark olive green). C Surfaces of BA.2.86 S─ACE2 complex treated at 42 °C for 1 h. Left: highly-open RBD conformation (S; mint green). Right: partially-open RBD conformation (S; dark yellow).

References

    1. WHO. BA.2.86 Initial Risk Evaluation, 21 November, 2023.) (2023).
    1. Kaku, Y. et al. Virological characteristics of the SARS-CoV-2 JN.1 variant. Lancet Infect. Dis.24, e82 (2024). - PubMed
    1. Yang, S. et al. Fast evolution of SARS-CoV-2 BA.2.86 to JN.1 under heavy immune pressure. Lancet Infect. Dis.24, e70–e72 (2024). - PubMed
    1. Tamura, T. et al. Virological characteristics of the SARS-CoV-2 BA.2.86 variant. Cell Host Microbe32, 170–180.e112 (2024). - PubMed
    1. Yang, X. et al. Immune escape of BA.2.86 is comparable to XBB subvariants from the plasma of BA.5- and BA.5-XBB-convalescent subpopulations. J. Med Virol.96, e29417 (2024). - PubMed

Publication types

MeSH terms

Substances