

Molecular insights into the activation mechanism of GPR156 in maintaining auditory function
- PMID: 39638804
- PMCID: PMC11621567
- DOI: 10.1038/s41467-024-54681-5
Molecular insights into the activation mechanism of GPR156 in maintaining auditory function
Abstract
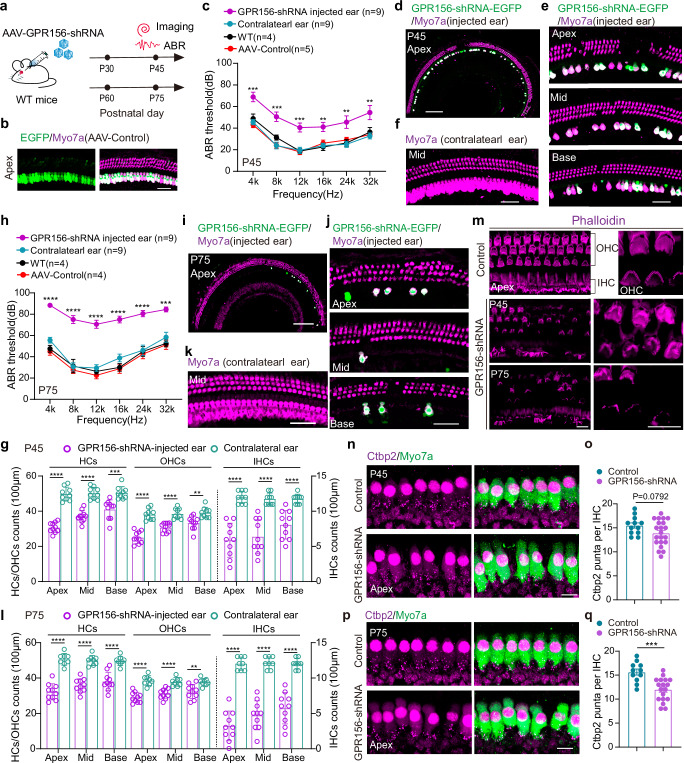
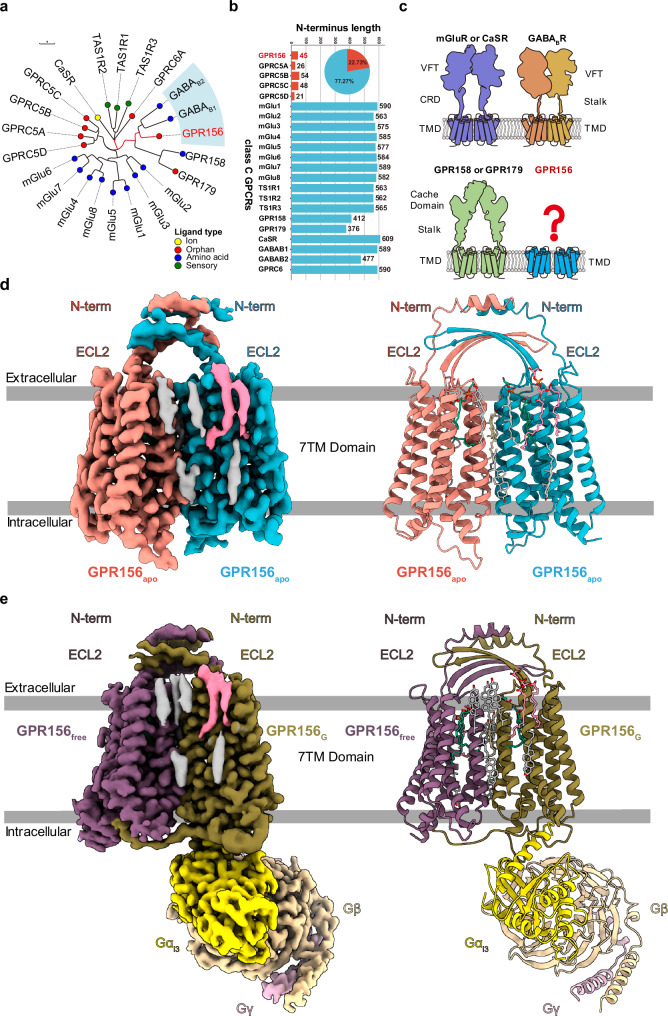
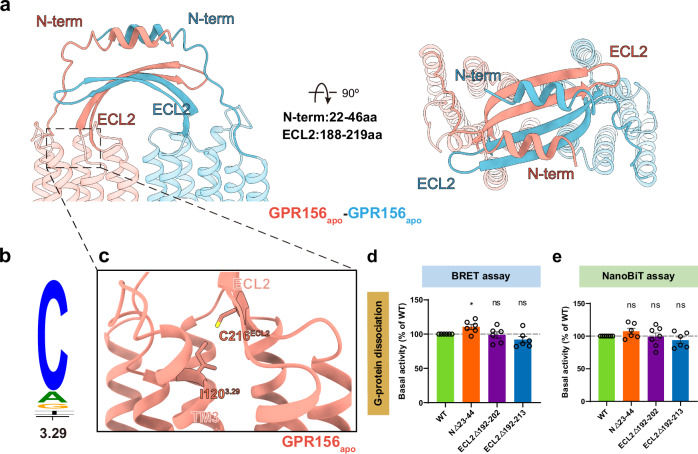
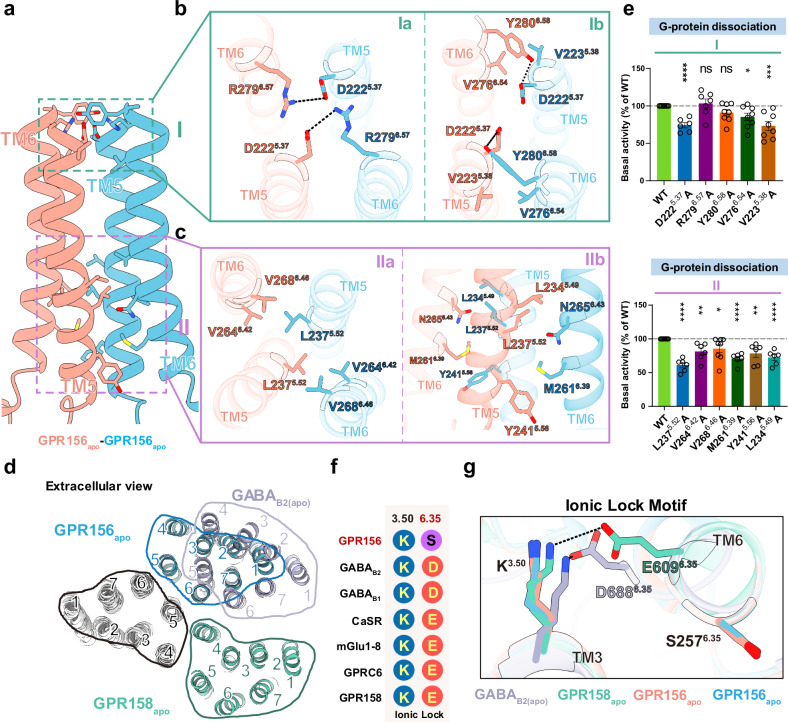
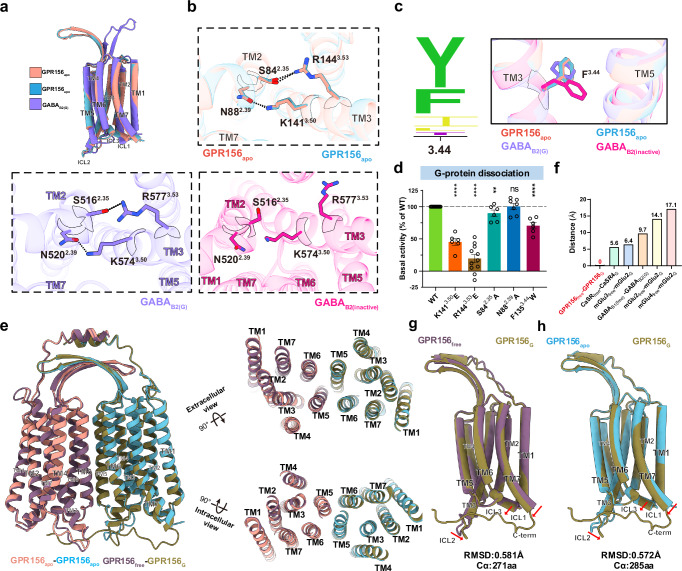
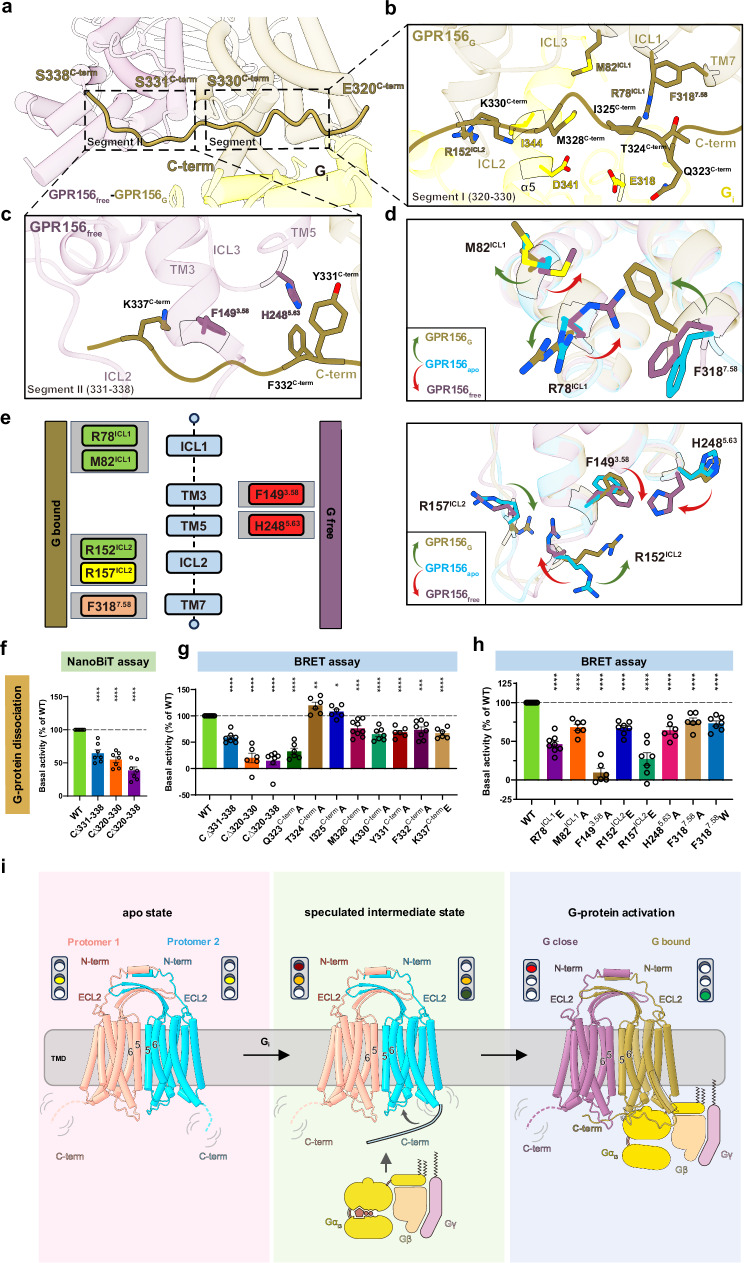
The class C orphan G-protein-coupled receptor (GPCR) GPR156, which lacks the large extracellular region, plays a pivotal role in auditory function through Gi2/3. Here, we firstly demonstrate that GPR156 with high constitutive activity is essential for maintaining auditory function, and further reveal the structural basis of the sustained role of GPR156. We present the cryo-EM structures of human apo GPR156 and the GPR156-Gi3 complex, unveiling a small extracellular region formed by extracellular loop 2 (ECL2) and the N-terminus. The GPR156 dimer in both apo state and Gi3 protein-coupled state adopt a transmembrane (TM)5/6-TM5/6 interface, indicating the high constitutive activity of GPR156 in the apo state. Furthermore, C-terminus in G-bound subunit of GPR156 plays a dual role in promoting G protein binding within G-bound subunit while preventing the G-free subunit from binding to additional G protein. Together, these results explain how GPR156 constitutive activity is maintained through dimerization and provide a mechanistic insight into the sustained role of GPR156 in maintaining auditory function.
© 2024. The Author(s).
Conflict of interest statement
Competing interests: The authors declare no competing interests.
Figures
References
-
- Charles, K. J., Calver, A. R., Jourdain, S. & Pangalos, M. N. Distribution of a GABAB-like receptor protein in the rat central nervous system. Brain Res.989, 135–146 (2003). - PubMed
Publication types
MeSH terms
Substances
Associated data
- Actions
- Actions
- figshare/10.6084/m9.figshare.25838170.v1
LinkOut - more resources
Full Text Sources
