. 2024 Nov 11;15(1):9768.
doi: 10.1038/s41467-024-54049-9.

Structure-derived insights from blood factors binding to the surfaces of different adenoviruses

Affiliations

Structure-derived insights from blood factors binding to the surfaces of different adenoviruses

Haley E Mudrick et al. Nat Commun. .

Abstract

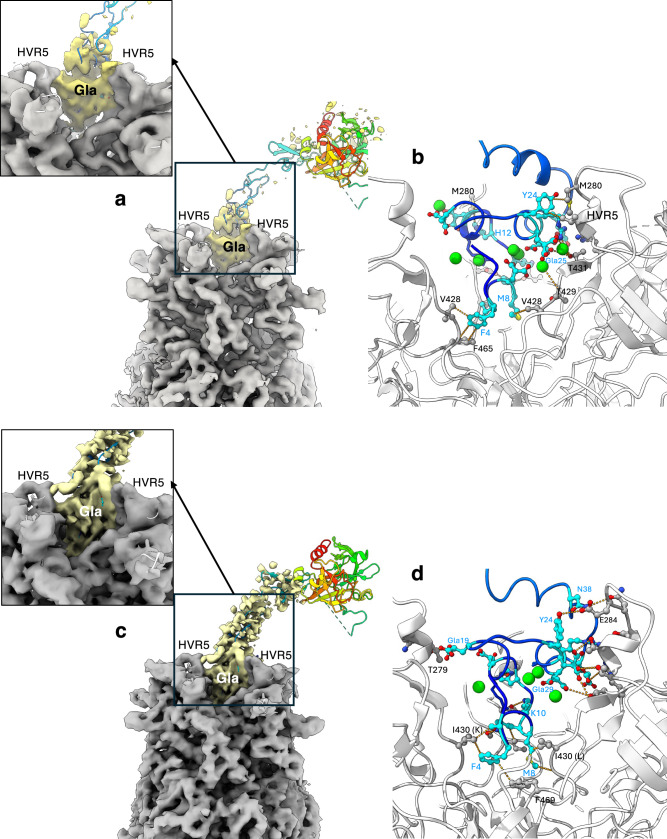
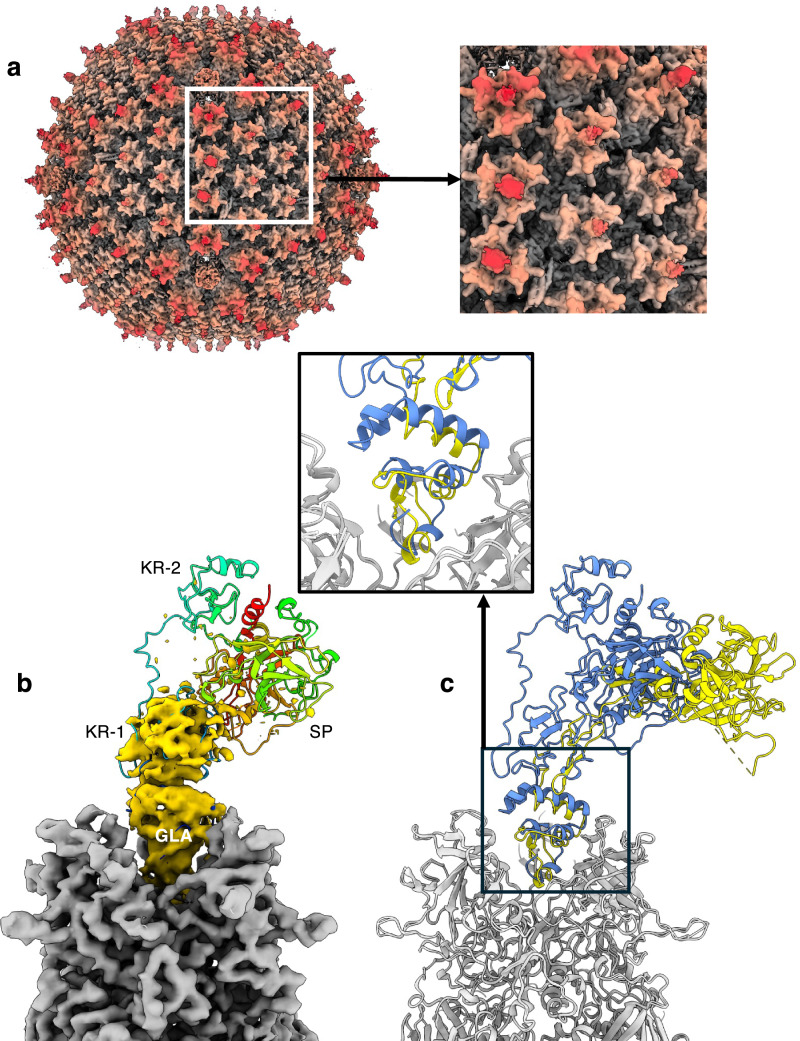
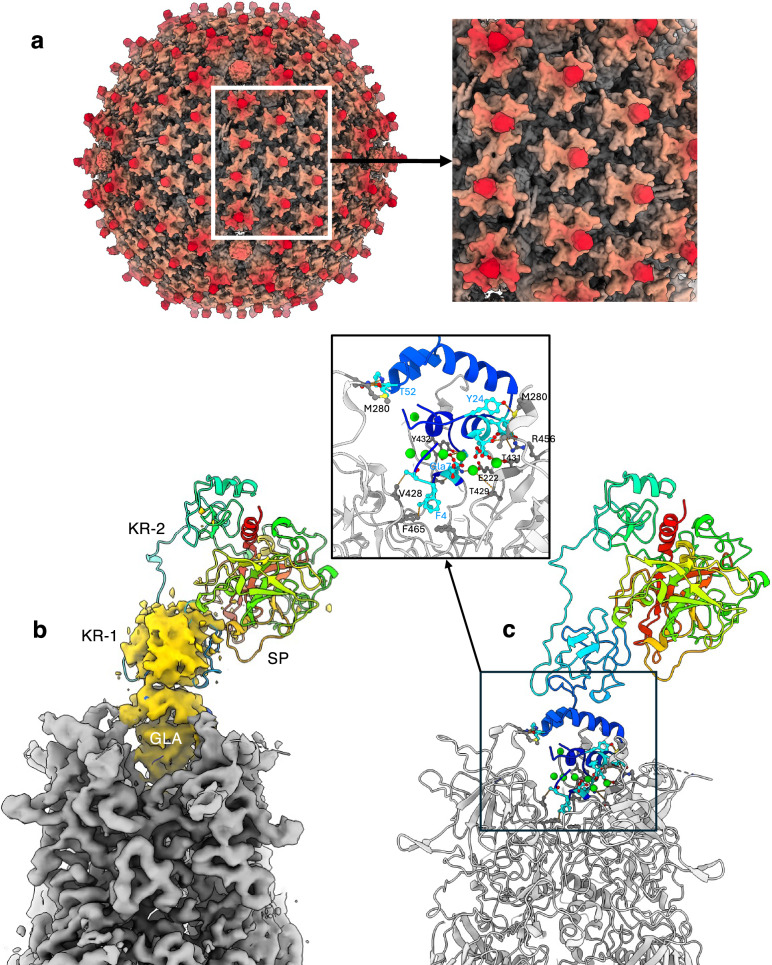
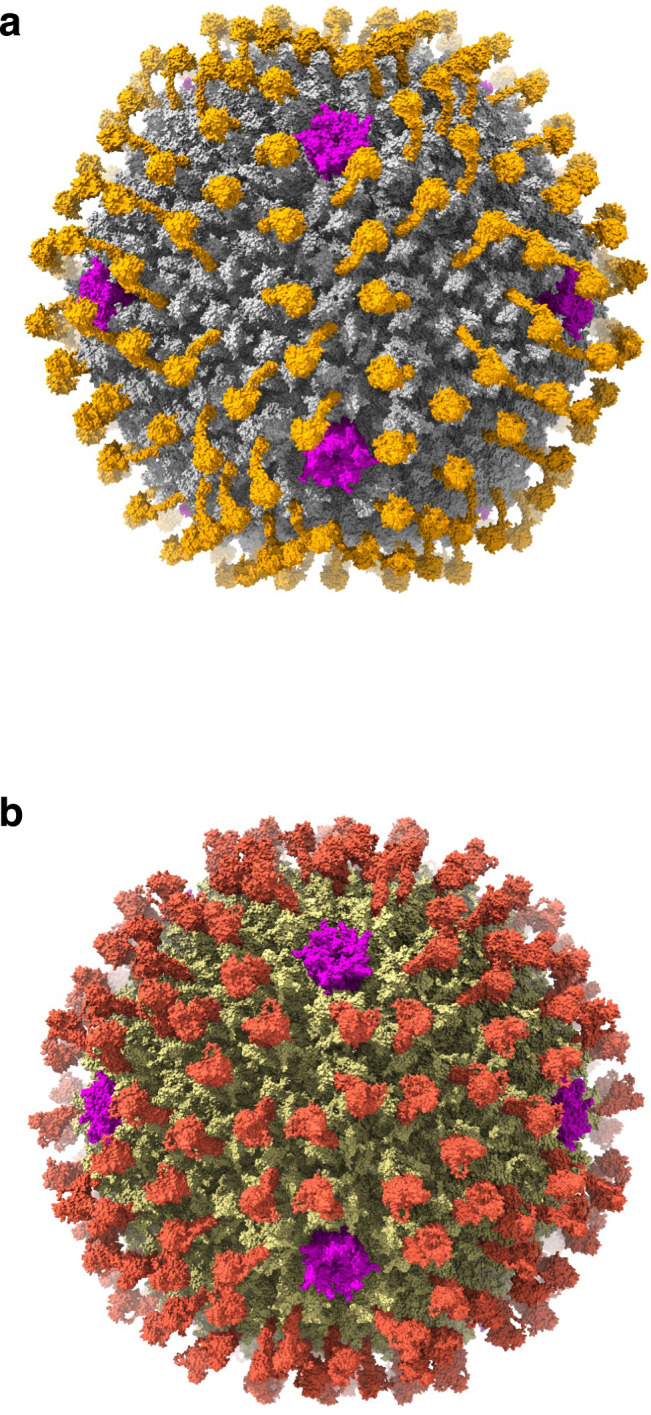
The tropism of adenoviruses (Ads) is significantly influenced by the binding of various blood factors. To investigate differences in their binding, we conducted cryo-EM analysis on complexes of several human adenoviruses with human platelet factor-4 (PF4), coagulation factors FII (Prothrombin), and FX. While we observed EM densities for FII and FX bound to all the species-C adenoviruses examined, no densities were seen for PF4, even though PF4 can co-pellet with various Ads. Similar to FX, the γ-carboxyglutamic acid (Gla) domain of FII binds within the surface cavity of hexon trimers. While FII binds equally to species-C Ads: Ad5, Ad6, and Ad657, FX exhibits significantly better binding to Ad5 and Ad657 compared to Ad6. Although only the FX-Gla domain is observed at high-resolution (3.7 Å), the entire FX is visible at low-resolution bound to Ad5 in three equivalent binding modes consistent with the 3-fold symmetric hexon. Only the Gla and kringle-1 domains of FII are visible on all the species-C adenoviruses, where the rigid FII binds in an upright fashion, in contrast to the flexible and bent FX. These data suggest that differential binding of FII and FX may shield certain species-C adenoviruses differently against immune molecules, thereby modulating their tropism.


Conflict of interest statement

Competing interests The authors declare no competing interests.

Figures

Fig. 1
Fig. 1. Cryo-EM reconstruction of Ad5-FX complex and hexon-FX interactions.
a Icosahedral reconstruction of Ad5-FX at 3.6 Å, a radially color-coded representation, displayed on a binned by 2 grid (contour level: 0.006). Unique hexons are numbered 1–4. It is notable that the PBs and fibers are weakly ordered. Shown below is a zoomed-in view of the hexon-4. The location of the FX-Gla-domain density found in the hexon cavity is identified by an asterisk. b A difference map at 3.6 Å, calculated by subtracting the Ad5 atomic model map (blue) from the Ad5-FX map shown in (a). The zoomed-in view below identifies the densities that belong to FX, identified by an asterisk and those that belong to the missing hexon-HVR loops are identified with the symbol “#”. c A difference map at 10 Å showing the blobs of FX density corresponding to 3 modes of FX binding to a single hexon (contour level: 0.0002). Zoomed-in view below identifies the locations of different domains of FX (Gla, EGF1&2, SP) and missing HVR1 loops. Of note, even though it appears that 3 copies of FX are bound to a single hexon, only a single copy of FX can bind to one hexon as the hexon cavity can accommodate a single Gla domain (Supplementary Fig. 3). d A localized reconstruction of hexon-FX complex at ~3.6 Å resolution. A modified AlphaFold2 model of FX containing Gla residues (rainbow ribbon) is docked into the corresponding density (khaki) for the Gla domain (contour level: 0.025). Shown on the left is a zoomed-in diagram of the boxed region. e A 90° rotated view of (d). f A localized reconstruction of hexon-FX (as in b) showing the density for EGF domain (khaki) displayed at a lower contour level (contour level: 0.0025). g Interactions between the Gla domain (blue) and the hexon trimer (gray). The interacting residues, FX-Gla (cyan) and hexon (gray), are shown in ball-and-stick representation with the dotted lines indicating some of the pairs of interacting residues. Ca2+ ions are shown as green spheres. The details of these interactions are listed In Supplementary Table 2.
Fig. 2
Fig. 2. Hexon-FX interactions in Ad657-FX and Ad6-FX complexes.
a Localized reconstruction of Ad657:hexon-FX complex at 3.86 Å (contour level: 0.014) derived from the icosahedral reconstruction of the Ad657-FX complex illustrated in Supplementary Fig. 5. The inset shows a zoomed-in view of the FX-Gla domain docked into the corresponding density shown in yellow. Location of HVR5 loops and the Gla domain are identified. b A closeup view of Ad657-hexon and FX interactions. Hexon model near the Gla-domain binding cavity is shown as gray ribbons. The interacting hexon and FX-Gla residues are shown in ball-and-stick representation, in gray and cyan colors, respectively and the Ca2+ are shown as green spheres. Some of the interacting residues are connected with dotted lines. Further details of the interacting residues are provided in Supplementary Table 2. c Localized reconstruction of Ad6:hexon-FX complex at 4.3 Å (contour level: 0.01) derived from the icosahedral reconstruction of the Ad6-FX complex illustrated in Supplementary Fig. 6. The inset shows a zoomed-in view of the FX-Gla domain docked into the corresponding density shown in yellow. d A closeup view of Ad6-hexon and FX interactions. Hexon model near the Gla-domain binding cavity is shown as gray ribbons. The interacting hexon and FX-Gla residues are shown in ball-and-stick representation, in gray and cyan colors, respectively and the Ca2+ ions are shown as green spheres. Some of the interacting residues are connected with dotted lines. Further details of the interacting residues in Ad-FX complexes are listed in Supplementary Table 2.
Fig. 3
Fig. 3. Cryo-EM reconstruction of Ad5-FII complex and hexon-FII interactions.
a Icosahedral construction of Ad5-FII at 4.1 Å. A radially color-coded representation with the bright red regions at the highest elevation corresponds to the bound FII molecules (contour level: 0.009). Inset shows a zoomed-in view of the white-boxed region. Of note, the PBs and fibers are weakly ordered/disordered. b A localized reconstruction of hexon-FII complex (contour levels: 0.02 (hexon), 0.007 (FII)). A modified AlphaFold2 model of FII with Gla residues is docked into the corresponding density shown in yellow. While the densities corresponding to the Gla and KR1 domains can be seen, the densities corresponding to KR2, and SP domains are disordered. c Superposition of Ad5-FII and Ad5-FX complexes. Hexon molecules are shown in gray, while the FII and FX molecules are shown in blue and yellow, respectively. The inset shows the zoomed-in view of the boxed area, where the FX-Gla domain appears to bind deeper than that of FII-Gla domain. Further details of the interacting residues in Ad-FII complexes are listed in Supplementary Table 3.
Fig. 4
Fig. 4. Cryo-EM reconstruction of Ad6-FII complex and hexon-FII interactions.
a Icosahedral reconstruction of Ad6-FII complex at 3.7 Å resolution(contour level: 0.007). A radially color-coded representation with the bright red regions at the highest elevation corresponds to the bound FII molecules. Inset shows a zoomed-in view of the boxed area. b A localized reconstruction of hexon-FII complex at 3.86 Å (contour level: 0.01). A modified AlphaFold2 model of FII with Gla residues shown in rainbow color gradient, is docked into the corresponding density shown in yellow. While the densities corresponding to the Gla and KR1 domains can be seen, the densities corresponding to KR2, and SP domains are disordered. c Ad6:hexon-FII:Gla interactions. Inset shows a zoomed-in view of the boxed area of the FII-Gla binding site. Some of the interacting residues of the Gla domain (cyan) and hexon (gray), connected by the dotted lines, are shown in ball-and-stick representation and identified by blue and black labels, respectively. The Ca2+ ions are shown as green spheres. A complete list of interacting pairs of residues in Ad6:hexon-FII complex is given in Supplementary Table 3.
Fig. 5
Fig. 5. Cryo-EM reconstruction of Ad657-FII complex and hexon-FII interactions.
a Icosahedral reconstruction of Ad657-FII complex at 4.2 Å resolution (contour level: 0.01). A radially color-coded representation with the bright red regions at the highest elevation corresponds to the bound FII molecules. Inset shows a zoomed-in view of the boxed area. b A localized reconstruction of hexon-FII complex at 4.1 Å (contour level: 0.004). A modified AlphaFold2 model of FII with Gla residues is docked into the corresponding density shown in yellow. As in the case of other Ad-FII complexes, only the densities corresponding to the Gla and KR1 domains can be seen, while the densities corresponding to KR2, and SP domains are disordered. c Ad657:hexon-FII:Gla interactions. Inset shows a zoomed-in view of the boxed area of the FII-Gla binding site. Some of the interacting residues of the Gla domain (cyan) and hexon (gray), connected by the dotted lines, are shown in ball-and-stick representation and identified by blue and black labels, respectively and the Ca2+ ions are shown as green spheres. A complete list of interacting pairs of residues in Ad657:hexon-FII complex are shown in Supplementary Table 3.
Fig. 6
Fig. 6. Illustrations of bound FX and FII molecules covering the surface of C-type AdV capsids.
a Distribution of the bound FX molecules (orange) on the surface of Ad5 capsid (gray) generated based on the cryo-EM reconstruction of Ad5-FX complex (Supplementary Fig. 3). The locations of PBs are shown in magenta. The disordered fibers are not represented. b Distribution of the bound FII molecules (brick red) on the surface of Ad6 capsid (khaki) generated based on the cryo-EM reconstruction of Ad6-FII complex (Supplementary Fig. 9). The PBs are shown in magenta. The disordered fibers are not represented.

References

    1. Campos, S. K. & Barry, M. A. Current advances and future challenges in Adenoviral vector biology and targeting. Curr. Gene Ther.7, 189–204 (2007). - PMC - PubMed
    1. Khare, R., Chen, C. Y., Weaver, E. A. & Barry, M. A. Advances and future challenges in adenoviral vector pharmacology and targeting. Curr. Gene Ther.11, 241–258 (2011). - PMC - PubMed
    1. Bailey, A. & Mautner, V. Phylogenetic relationships among adenovirus serotypes. Virology205, 438–452 (1994). - PubMed
    1. Arnberg, N. Adenovirus receptors: implications for tropism, treatment and targeting. Rev. Med. Virol.19, 165–178 (2009). - PubMed
    1. Weaver, E. A. et al. Characterization of species C human adenovirus serotype 6 (Ad6). Virology412, 19–27 (2011). - PMC - PubMed

Publication types

LinkOut - more resources