. 2024 Oct 8;15(1):8718.
doi: 10.1038/s41467-024-52512-1.

The discovery and structural basis of two distinct state-dependent inhibitors of BamA

Affiliations

The discovery and structural basis of two distinct state-dependent inhibitors of BamA

Dawei Sun et al. Nat Commun. .

Abstract

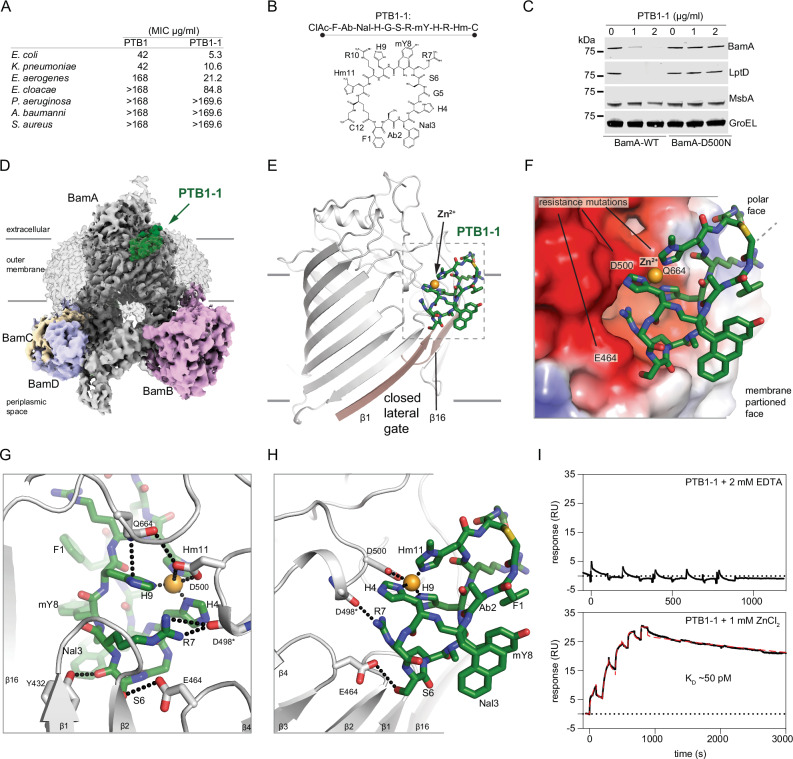
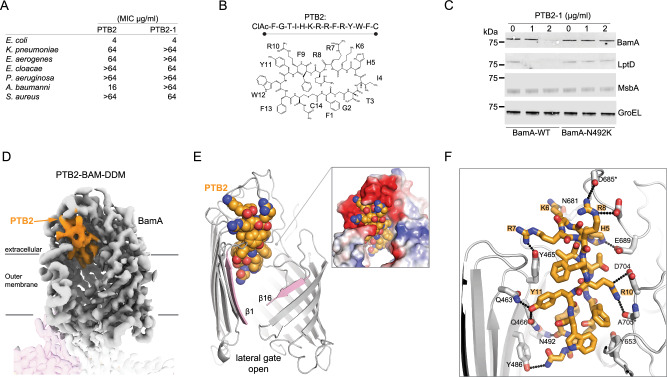
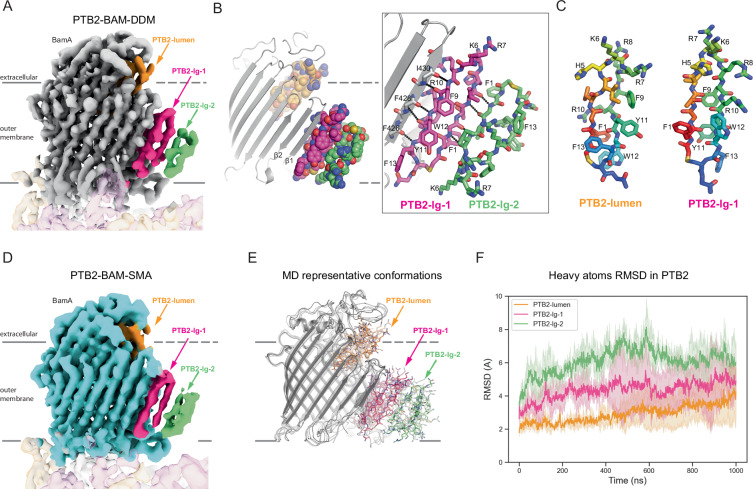
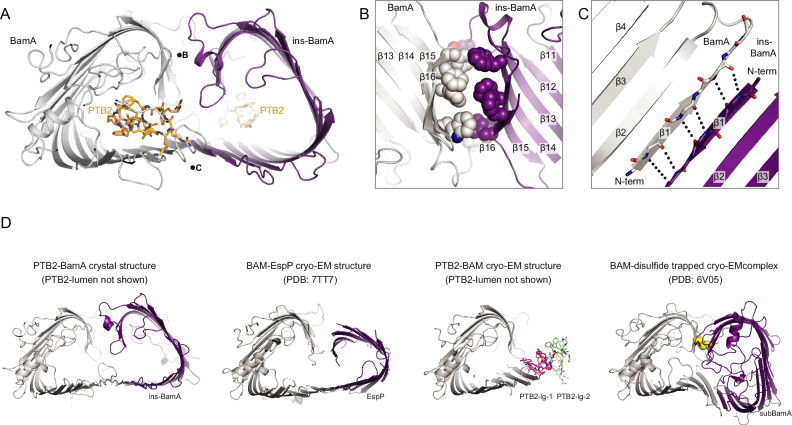
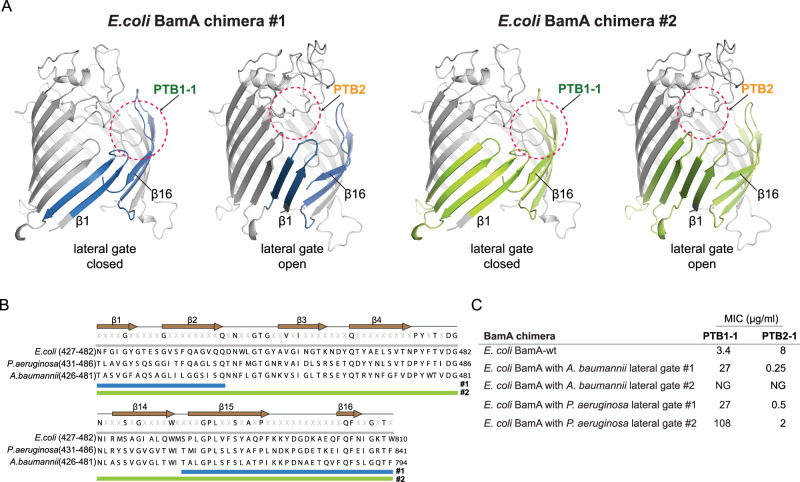
BamA is the central component of the essential β-barrel assembly machine (BAM), a conserved multi-subunit complex that dynamically inserts and folds β-barrel proteins into the outer membrane of Gram-negative bacteria. Despite recent advances in our mechanistic and structural understanding of BamA, there are few potent and selective tool molecules that can bind to and modulate BamA activity. Here, we explored in vitro selection methods and different BamA/BAM protein formulations to discover peptide macrocycles that kill Escherichia coli by targeting extreme conformational states of BamA. Our studies show that Peptide Targeting BamA-1 (PTB1) targets an extracellular divalent cation-dependent binding site and locks BamA into a closed lateral gate conformation. By contrast, PTB2 targets a luminal binding site and traps BamA into an open lateral gate conformation. Our results will inform future antibiotic discovery efforts targeting BamA and provide a template to prospectively discover modulators of other dynamic integral membrane proteins.


Conflict of interest statement

D.S., K.M.S., D.T., Y.Y., C.P.A., M.J., J.G.Q., W.L., G.H., H.S.G., M.K.A., S.S., C.T., C.E.H., W.J.F., M.W.T., N.S., W.S., B.D.S., Cl.C., P.A.S., C.N.C., S.T.R., and J.P. are or were employees of Genentech Inc. Hiroshi I., Hiroko I., T.S., H.Y., J.N., and P.C.R. are employees of PeptiDream Inc. The remaining authors declare no competing interests.

Figures

Fig. 1
Fig. 1. Activity and cryo-EM structure of the closed-state PTB1-1–BAM complex.
A Minimal inhibitory concentrations (MICs) for BamA-binding macrocycles PTB1 and PTB1-1 on indicated bacterial species. MIC assays were performed in triplicate with mean values reported. The molecular weights of PTB1 and PTB1-1 are 1678.88 and 1705.90 g/mol, respectively. B Amino acid sequence and schematic of BamA-binding PTB1-1 macrocycle. CIAc-F (N-α-chloroacetyl-l-phenylalanine), Ab (l-α-aminobutanoic acid), Nal (β-(1-naphthyl)-l-alanine), H (l-histidine), G (glycine), S (l-serine), R (l-arginine), mY (N-α-methyl-L-tyrosine), Hm (3-methyl-l-histidine), C (l-cysteine). C Western blot of E. coli wild-type (BamA-WT) and a representative PTB1-1-resistant strain (BamA-D500N) for select outer membrane (BamA and LptD), inner membrane (MsbA), and cytoplasmic (GroEL) proteins under increasing concentrations of PTB1-1. Dashes represent location of 75 kDa molecular weight marker on each blot. This is representative of two replicates and the full blots are provided in Source Data. D Cryo-EM map of the PTB1-1–BAM–MAB2 Fab complex. Lower contours of the map that include detergent micelle and MAB2 Fab are shown in transparency. BAM subunits are labeled and BamA is shown in gray, BamB in pink, BamC in wheat, BamD in light blue, and BamE is not visible in the presented orientation. PTB1-1 is shown in green. Approximate outer membrane boundaries are indicated. E Overall view of the PTB1-1–BamA complex. PTB1-1 is shown in green, lateral gate β-strands are shown in tan, and assigned Zn2+ cation is shown as an orange sphere. Approximate outer membrane boundaries are indicated. F Electrostatics of the PTB1-1 binding site on BamA. Select positions where substitutions lead to PTB1-1 resistance are labeled and the assigned Zn2+ cation is shown as an orange sphere. Red, blue, and white represents negative, positive, and neutral charge, respectively. G and H Close-in views of the PTP1-1 interactions with BamA. BamA is shown in gray and PTB1-1 is shown in green, with direct bonding interactions indicated by dotted lines. I Duplicate SPR sensorgram of PTB1-1 interaction with surface-bound BamA in the presence of 2 mM EDTA (top) or 1 mM ZnCl2 (bottom) where the latter is fit using a two-state model, KD = (kd1/kd2)*(kd2/(ka2 + kd2)) to calculate the KD = 50 ± 2 pM in the presence of ZnCl2 (model curve is displayed as a dashed red line). No binding was observed in the presence of EDTA.
Fig. 2
Fig. 2. Activity and cryo-EM structure of the open-state PTB2-BAM-DDM complex.
A Minimal inhibitory concentrations (MICs) for BamA-binding macrocycles of PTB2 and PTB2-1 on indicated bacterial species. MIC assays were performed in triplicate with mean values reported. The molecular weights of PTB2 and PTB2-1 are 2013.33 and 2043.40 g/mol, respectively. B Amino acid sequence and schematic of BamA-binding PTB2 marcocycle. CIAc-F (N-α-chloroacetyl-l-phenylalanine), G (glycine), T (l-threonine), I (l-isoleucine), H (l-histidine), K (l-lysine), R (l-arginine), F (l-phenylalanine), Y (l-tyrosine), W (l-tryptophan), C (l-cysteine). C Western blot of E. coli wild-type (BamA-WT) and a representative PTB2-1-resistant strain (BamA-N492K) for select outer membrane (BamA and LptD), inner membrane (MsbA), and cytoplasmic (GroEL) proteins under increasing concentrations of PTB2-1. Dashes represent the location of the 75 kDa molecular weight marker on each blot. This is representative of 2 replicates, and the full blots are provided in Source Data. D Cryo-EM map of the PTB2–BAM–DDM complex. BamA is shown in gray, BamB in pink, and BamC, BamD, and BamE are present but not labeled/shown for clarity. PTB2 bound in the central lumen is shown in orange. Lines indicate the approximate boundaries of the outer membrane. E Overall view of PTB2 bound to BamA with open lateral gate. PTB2 is shown in orange, and the lateral gate is shown in pink. The electrostatics of the PTB2 binding site are shown (inset) with red, blue, and white representing negative, positive, and neutral charges, respectively. F Close-in view of PTB2 interactions with BamA. BamA is shown in gray and PTB2 is shown in orange, with direct bonding interactions indicated by dotted lines.
Fig. 3
Fig. 3. PTB2 occupies the lateral gate of BamA.
A Cryo-EM map of the PTB2–BAM–DDM complex. PTB2-lumen bound in the BamA β-barrel lumen is shown in orange and the two PTB2 molecules bound at the lateral gate of BamA are shown in pink (PTB2-lg-1) and green (PTB2-lg-2). BamA is shown in gray and the approximate boundaries of the outer membrane are indicated. B Model and interactions between the two PTB2 molecules bound at the lateral gate of BamA. PTB2-lumen bound in the BamA β-barrel lumen (orange) and the two macrocycles bound at the later gate, PTB2-lg-1 (pink) and PTB2-lg-2 (green), are shown. C Comparison of the PTB2 macrocycles bound in the BamA β-barrel lumen (PTB2-lumen) and at the lateral gate of BamA (PTB2-lg-1). D Cryo-EM map of the PTB2–BAM–SMA complex. Three bound PTB2 molecules are shown bound in the BamA β-barrel lumen (PTB2-lumen, orange) and at the BamA lateral gate, PTB2-lg-1 (pink) and PTB2-lg-2 (green), are shown. BamA is shown in cyan and the approximate boundaries of the outer membrane are indicated. E Representative molecular dynamics (MD) conformations of PTM2–BAM–DDM from simulation frames sampled every 250 ns. BamA is shown in gray, PTB2 bound in the BamA β-barrel lumen in orange, PTB2-lg-1 in pink, and PTB2-lg-2 in green. The approximate boundaries of the outer membrane are indicated. MD input–output files in Source Data. F Heavy atoms RMSD of the three PTB2 macrocycles bound to BamA in the PTB2–BAM–DDM complex over time from molecular dynamics (MD) simulations. Data with PTB2-lumen, PTB2-lg-1, and PTB2-lg-2 are colored as shown in Fig. 1E. An average of three independent runs is plotted and MD input–output files are provided in Source Data.
Fig. 4
Fig. 4. Crystal structure of the open lateral gate PTB2–BamA complex.
A Overall arrangement of two PTB2–BamA complexes observed within the X-ray crystal lattice. One BamA molecule is named ins-BamA (purple), and the other BamA is shown in gray. The PTB2 macrocycle is shown in orange. Positions of the views shown in panels B and C are noted with the corresponding letter. B Close-in view of the BamA (gray)/ins-BamA (purple) β14–β16/β14–β16 interaction interface. C Close-in view of the BamA (gray)-ins-BamA (purple) β1–β1 interaction interface. D Comparison of the crystal structure of PTB2-BamA (left, BamA in gray and ins-BamA in purple), the cryo-EM structure of BAM–EspP complex (middle-left, BamA in gray and EspP in purple), the cryo-EM structure of PTB2-BAM (middle-right, BamA in gray, PTB2-lg-1 shown in pink and PTB2-lg-2 shown in green), and the cryo-EM structure of BAM–disulfide trapped complex (right, BamA in gray, subBamA in purple, and disulfide in yellow).
Fig. 5
Fig. 5. E. coli BamA lateral gate chimeras remain sensitive to PTB2 inhibition.
A The lateral gate of the E. coli BamA barrel was substituted with the lateral gate sequence from A. baumannii or P. aeruginosa. As described in the main text, chimera #2 (green, right) has more extensive substitutions compared to chimera #1 (blue, left), and all swapped regions are highlighted in the context of our PTB1-1–BAM structure (left: closed lateral gate) and PTB2-BAM structure (right: open lateral gate), respectively. The approximate binding site location of PTB1-1 and PTB2 are circled with pink dashed lines. B Sequence alignments of BamA from E. coli, P. aeruginosa, and A. baumannii in the regions encompassing chimeras #1 (blue bar) and #2 (green bar) substitutions. C Minimal Inhibitory Concentrations (MICs) for BamA-binding macrocycles of PTB1-1 and PTB2-1 with E. coli strains producing the indicated BamA chimeras. MIC assays were performed in triplicate with mean values reported. Note, the more extensive chimera #2 with the A. baumannii sequence failed to grow under the assay conditions. NG no growth.

References

    1. Nikaido, H. Molecular basis of bacterial outer membrane permeability revisited. Microbiol. Mol. Biol. Rev.67, 593–656 (2003). - PMC - PubMed
    1. Tomasek, D. & Kahne, D. The assembly of β-barrel outer membrane proteins. Curr. Opin. Microbiol.60, 16–23 (2020). - PMC - PubMed
    1. Koebnik, R., Locher, K. P. & Gelder, P. V. Structure and function of bacterial outer membrane proteins: barrels in a nutshell. Mol. Microbiol.37, 239–253 (2000). - PubMed
    1. Franklin, M. W. & Slusky, J. S. G. Tight turns of outer membrane proteins: an analysis of sequence, structure, and hydrogen bonding. J. Mol. Biol.430, 3251–3265 (2018). - PMC - PubMed
    1. Wu, T. et al. Identification of a multicomponent complex required for outer membrane biogenesis in Escherichia coli. Cell121, 235–245 (2005). - PubMed

Publication types

MeSH terms

LinkOut - more resources