. 2015 May 19;42(5):839-849.
doi: 10.1016/j.immuni.2015.04.009. Epub 2015 May 12.

Structure of the Complex of F-Actin and DNGR-1, a C-Type Lectin Receptor Involved in Dendritic Cell Cross-Presentation of Dead Cell-Associated Antigens

Affiliations

Structure of the Complex of F-Actin and DNGR-1, a C-Type Lectin Receptor Involved in Dendritic Cell Cross-Presentation of Dead Cell-Associated Antigens

Pavel Hanč et al. Immunity. .

Abstract

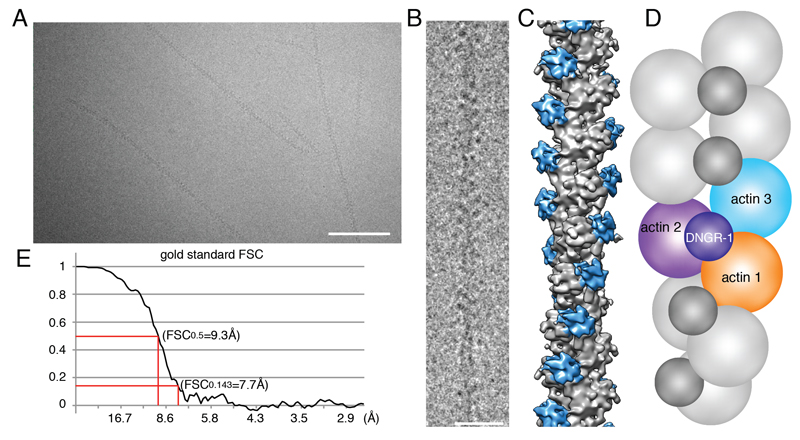
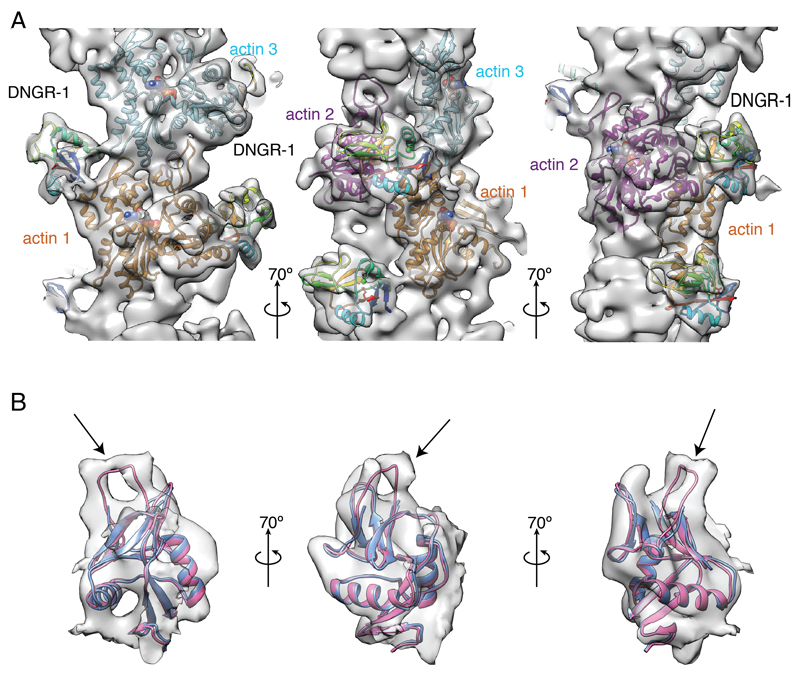
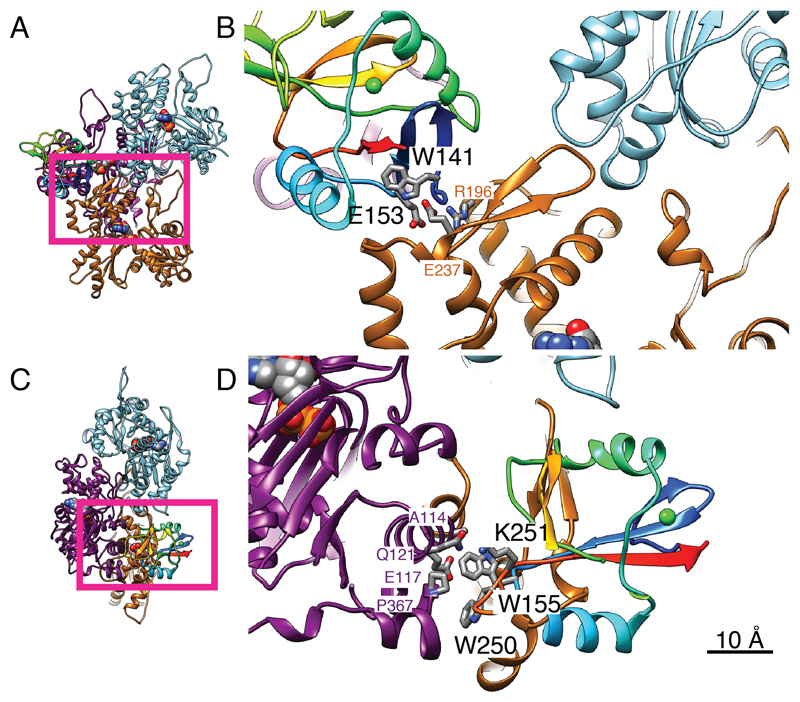
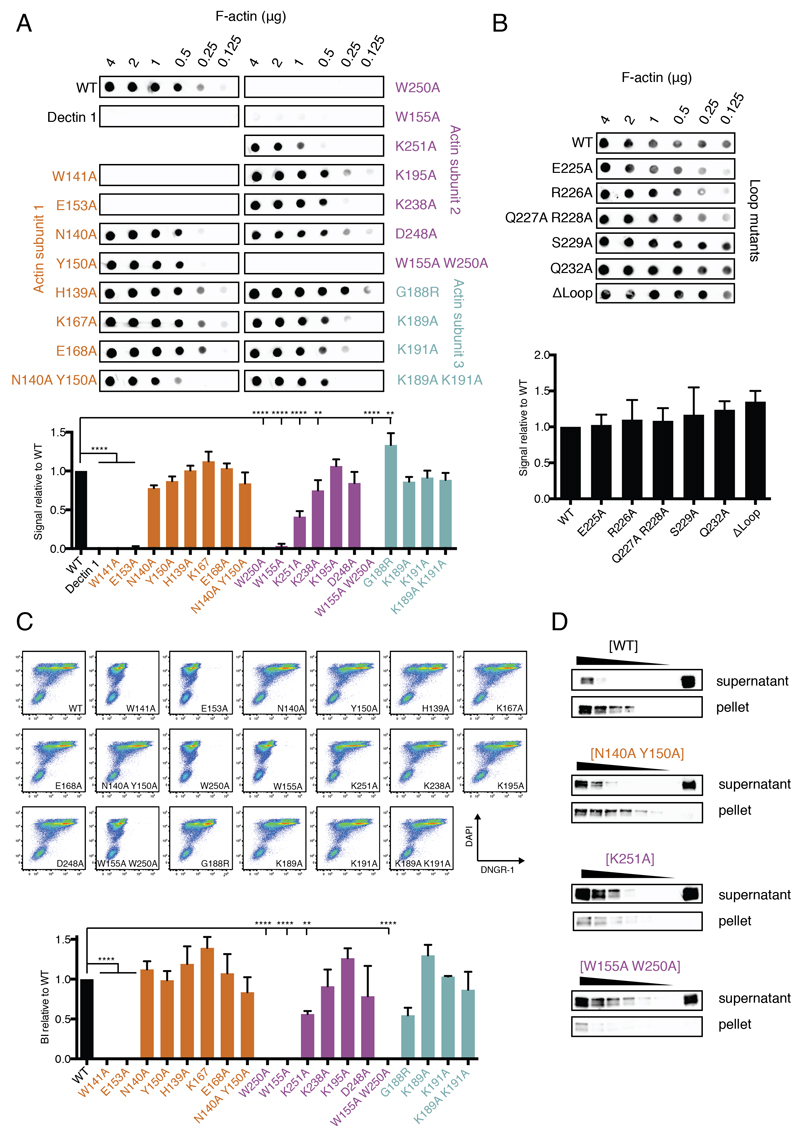
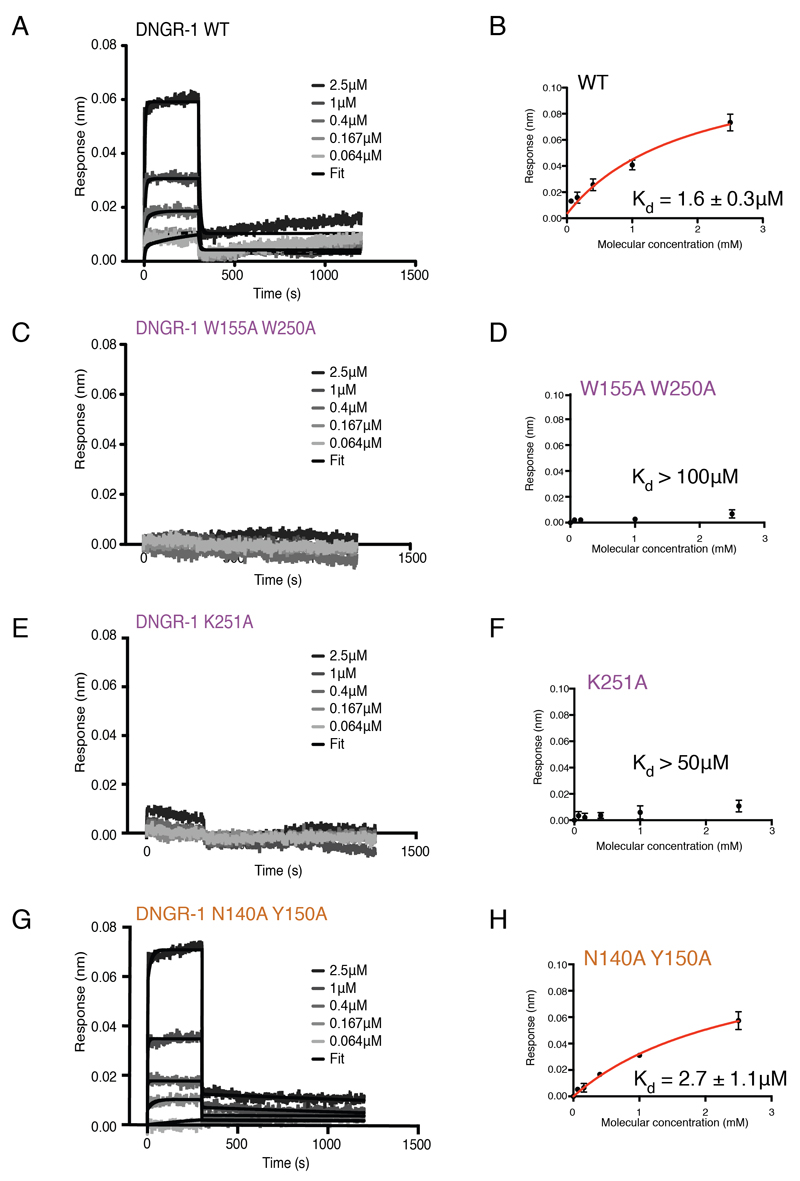
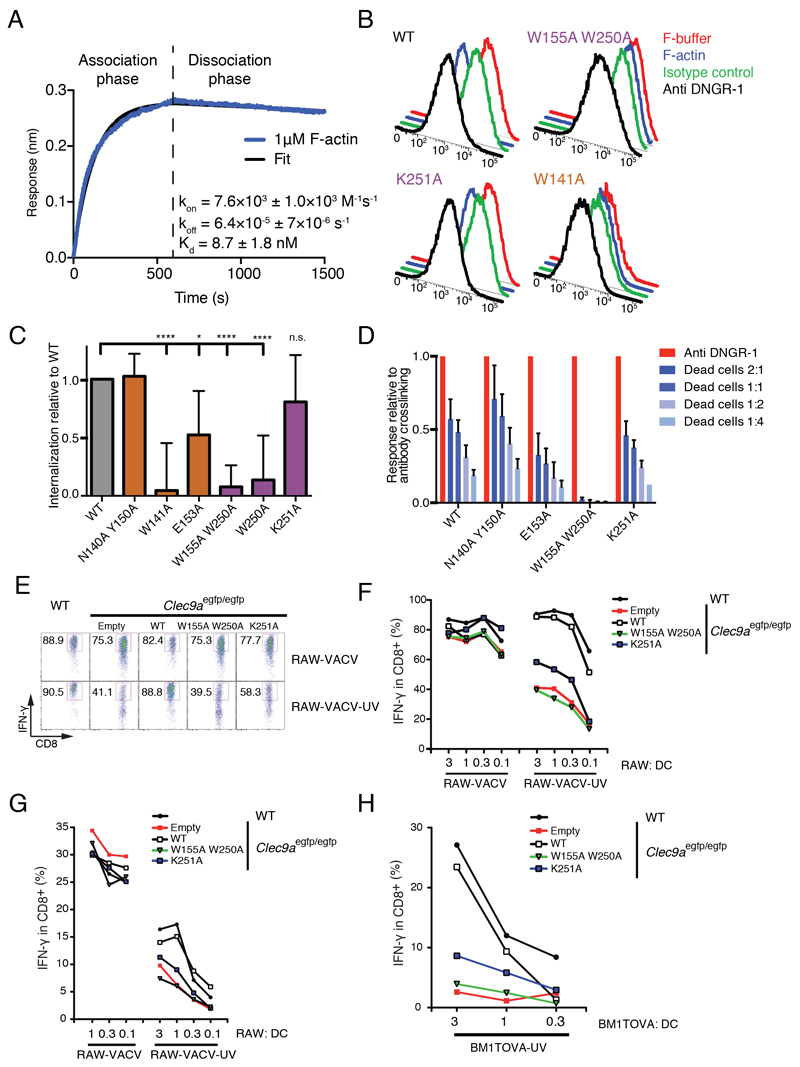
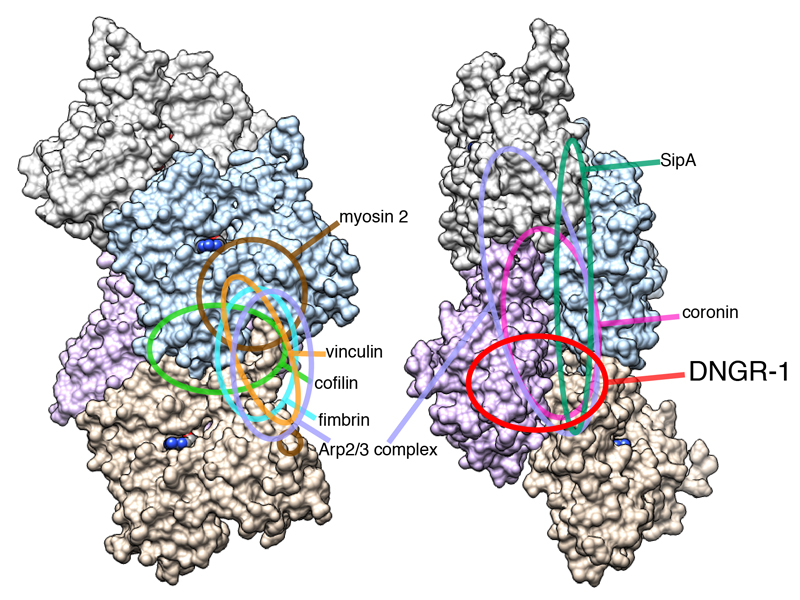
DNGR-1 is a C-type lectin receptor that binds F-actin exposed by dying cells and facilitates cross-presentation of dead cell-associated antigens by dendritic cells. Here we present the structure of DNGR-1 bound to F-actin at 7.7 Å resolution. Unusually for F-actin binding proteins, the DNGR-1 ligand binding domain contacts three actin subunits helically arranged in the actin filament, bridging over two protofilaments, as well as two neighboring actin subunits along one protofilament. Mutation of residues predicted to mediate ligand binding led to loss of DNGR-1-dependent cross-presentation of dead cell-associated antigens, formally demonstrating that the latter depends on F-actin recognition. Notably, DNGR-1 has relatively modest affinity for F-actin but multivalent interactions allow a marked increase in binding strength. Our findings shed light on modes of actin binding by cellular proteins and reveal how extracellular detection of cytoskeletal components by dedicated receptors allows immune monitoring of loss of cellular integrity.


Figures

Figure 1
Figure 1. Structure of F-actin decorated with DNGR-1.
A, B, CryoEM images of DNGR-1-decorated F-actin in a frozen-hydrated state at two different magnifications, scale bars correspond to 50nm and 20nm respectively. C, Solid surface representation of the 3D density map of DNGR-1 decorated F-actin at 7.7 Å resolution obtained by helical image reconstruction. F-actin is colored grey and DNGR-1 blue. D, Schematic representation of the data in C: DNGR-1 binds to the interface between actin protofilaments making contact with three actin filament subunits (arbitrarily numbered 1-3). E, Fourier shell correlation was performed to determine the resolution of the 3D map. See also Supplemental Figure 1 and Supplemental Table 1.
Figure 2
Figure 2. Helical reconstruction reveals the mode of binding of DNGR-1 to F-actin and a flexible loop missing from the crystal structure of the DNGR-1 CTLD.
A, Three different views of main chain ribbon models of F-actin (actin subunits 1, 2, 3 from Figure 1D colored in orange, magenta, cyan, respectively) and DNGR-1 CTLD (rainbow color) fitted into the density map. B, Overlay of the crystal structure of DNGR-1 CTLD (pdb ID 3VPP; blue) and model (in magenta) of DNGR-1 CTLD including the flexible loop (R226 – A230; indicated by arrow) fitted into the observed electron density. See also Supplemental Figure 2 and Supplemental Movie 1.
Figure 3
Figure 3. The binding interface of DNGR-1 CTLD and F-actin.
A, B, N-terminal region of the CTLD interacting with actin 1 (orange) and actin 3 (cyan). C, D, the opposite face of the CTLD interacting with actin 2 (magenta). A and C are guides to show the portions displayed in more detail in B and D, respectively. The viewing directions of A, B and C, D correspond to the left and right panels of Figure 2A, respectively, and actin subunit numbering and coloring is as in Figure 1D. DNGR-1 CTLD is colored rainbow. Side chains of the CTLD amino acids identified by mutagenesis as important for F-actin binding are labeled in black lettering and are displayed as a stick model with oxygen in blue, nitrogen in red and carbon in grey. Actin side chains that are identified in the structural model as possible binding partners are also displayed in the same way and are labeled in the color of the corresponding actin subunit. The sequence number and identity of each amino acid are for mouse CTLD and human platelet actin. Scale bar corresponds to 10Å. See also Supplemental Table 2.
Figure 4
Figure 4. Identification of DNGR-1 residues essential for binding F-actin
A, and B, The indicated amounts of F-actin were spotted onto a nitrocellulose membrane and probed with WT or mutant DNGR-1 ECD proteins at equal concentrations. Strength of signal was quantified and plotted relative to WT (lower panel). The dot blot data depicted are from one representative experiment of 3. The quantitation is based on 3 experiments and the data represent mean ± s.d. *P < 0.05, **P < 0.01, ***P < 0.001, ****P < 0.0001; One-way ANOVA with Dunnett’s multiple comparisons test. C, HeLa cells were UV-irradiated, cultured overnight to allow secondary necrosis, and stained with WT or mutant DNGR-1 ECD proteins at equal concentrations. Binding was analyzed by flow cytometry using DAPI to identify dead cells (upper panel) and binding index was calculated (lower panel). The plots shown are from one representative experiment of 3. The binding index is from 3 pooled experiments and the data represent mean ± s.d. *P < 0.05, **P < 0.01, ***P < 0.001, ****P < 0.0001; One-way ANOVA with Dunnett’s multiple comparisons test. D, F-actin was incubated with a 2-fold dilution of WT or mutant DNGR-1 ECD proteins (decreasing protein concentration indicated by the wedge). The samples were ultracentrifuged and both pellet and supernatant fractions were tested for presence of DNGR-1 proteins by SDS-PAGE and immunoblot. Data are representative of 4 experiments for the WT and 2 experiments for each mutant. The font color used for the mutant name is meant to represent the actin subunit to which the residue normally binds, as depicted in Figure 1D. See also Supplemental Figure 3.
Figure 5
Figure 5. Real-time measurement of DNGR-1 binding to F-actin
F-actin was polymerized directly on a BLI sensor and binding of the indicated concentrations of A, WT, C, W155A W250A E, K251A and G, N140A Y150A DNGR-1 ECD was monitored in real time. Representative examples of binding curves are shown. Steady state analysis of binding for B, WT, D, W155A W250A F, K251A and H, N140A Y150A DNGR-1. Data points are the mean ± SD of 7 replicate experiments for WT, 3 replicate experiments for N140A Y150A mutant and 2 replicate experiments for W155A W250A and K251A mutants. Numbers represent best-fit curve values ± standard error. The font color used for the mutant name is meant to represent the actin subunit to which the residue normally binds, as depicted in Figure 1D. See also Supplemental Figure 4.
Figure 6
Figure 6. Avidity increases the strength of DNGR-1 : F-actin binding
A, WT DNGR-1 ECD was immobilized on a BLI sensor and binding of of short F-actin filaments was monitored in real time. Data shown are representative of 6 replicate experiments. Numbers are the mean value ± s.d. of all 6 experiments. B, Cells expressing full-length WT or mutant DNGR-1 trans-membrane proteins were treated with F-actin, anti-DNGR-1 antibody, F-buffer or control antibody, incubated at 37°C for 60 minutes and fixed before staining for DNGR-1 and analysis by flow cytometry. Profiles depict surface expression of DNGR-1 WT and selected mutants. The image is representative of 6 experiments. C, Data from 6 independent experiments carried out as in B, were normalized to the antibody induced internalization and expressed as mean ± s.d. internalization relative to WT. *P < 0.05, **P < 0.01, ***P < 0.001, ****P < 0.0001; One-way ANOVA with Dunnett’s multiple comparisons test. In A-C, the font color used for the mutant name is meant to represent the actin subunit to which the residue normally binds, as depicted in Figure 1D. D, B3Z-Syk reporter cells expressing WT or mutant DNGR-1 receptors were incubated with decreasing numbers of UV-irradiated HeLa cells (ratio dead:reporter cells is indicated) or with plate-bound anti-DNGR-1 antibody or medium alone at 37°C overnight. Activation of the NFAT reporter was read out at the end of the incubation period. Data are normalized and expressed as mean ± s.d. of three independent experiments. E-G, RAW264.7 (RAW) cells were infected with rVACV OVA and not irradiated (RAW-VACV) or infected and UV-irradiated (RAW-VACV-UV). They were fed at the indicated ratios to DCs from WT or Clec9aegfp/egfp mice transduced or not with retroviruses encoding WT or the indicated mutant DNGR-1 constructs. OVA-specific CD8+ T cells (E, F) or VACV-specific CD8+ T cells (G) were added and IFN-γ production was measured after 6h. H, Cross-presentation of UV-treated BM1TOVA (BM1TOVA-UV) was also assessed using OVA-specific CD8+ T cells. In (E), dot plots show the production of IFN-γ by CD8+ T cells specific for OVA at the ratio 3:1 infected cells:DC. In (F-H), graphs depict the frequencies of IFN-γ+ CD8+ T cells specific for OVA (F, H) or VACV (G). E-H: one representative experiment of three performed is shown. See also Supplemental Figure 5.
Figure 7
Figure 7. Distinct DNGR-1 footprint on F-actin.
Schematic depiction of binding footprints for canonical F-actin binding proteins on F-actin compared with the footprint of the DNGR-1 CTLD.

References

    1. Abdiche Y, Malashock D, Pinkerton A, Pons J. Determining kinetics and affinities of protein interactions using a parallel real-time label-free biosensor, the Octet. Analytical biochemistry. 2008;377:209–217. - PubMed
    1. Ahrens S, Zelenay S, Sancho D, Hanc P, Kjaer S, Feest C, Fletcher G, Durkin C, Postigo A, Skehel M, et al. F-actin is an evolutionarily conserved damage-associated molecular pattern recognized by DNGR-1, a receptor for dead cells. Immunity. 2012;36:635–645. - PubMed
    1. Caminschi I, Proietto AI, Ahmet F, Kitsoulis S, Shin Teh J, Lo JC, Rizzitelli A, Wu L, Vremec D, van Dommelen SL, et al. The dendritic cell subtype-restricted C-type lectin Clec9A is a target for vaccine enhancement. Blood. 2008;112:3264–3273. - PMC - PubMed
    1. Collins BE, Paulson JC. Cell surface biology mediated by low affinity multivalent protein-glycan interactions. Current opinion in chemical biology. 2004;8:617–625. - PubMed
    1. Connor RJ, Kawaoka Y, Webster RG, Paulson JC. Receptor specificity in human, avian, and equine H2 and H3 influenza virus isolates. Virology. 1994;205:17–23. - PubMed

Publication types

Associated data