. 2024 Nov;635(8037):178-185.
doi: 10.1038/s41586-024-07991-z. Epub 2024 Oct 16.

An ancient ecospecies of Helicobacter pylori

Collaborators, Affiliations

An ancient ecospecies of Helicobacter pylori

Elise Tourrette et al. Nature. 2024 Nov.

Abstract

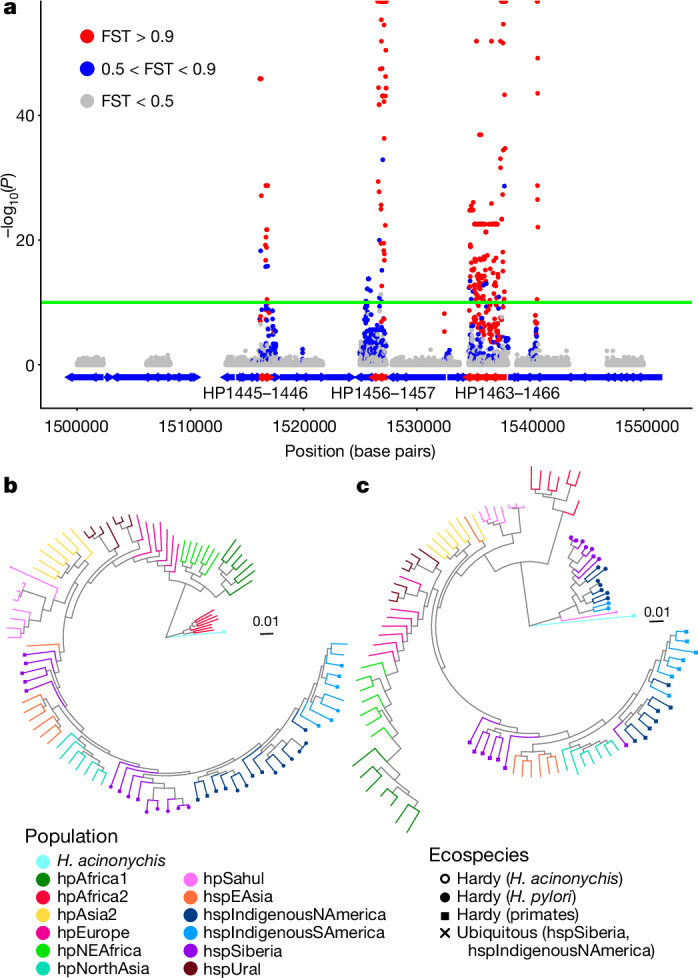
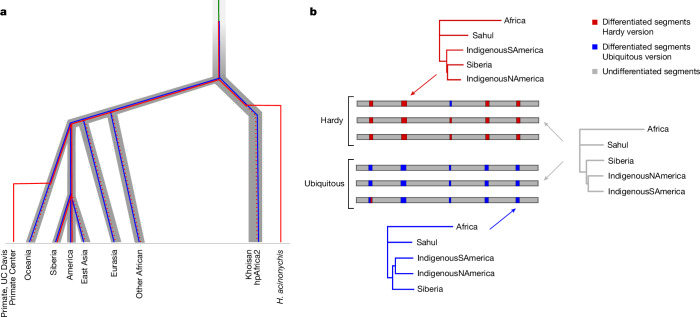
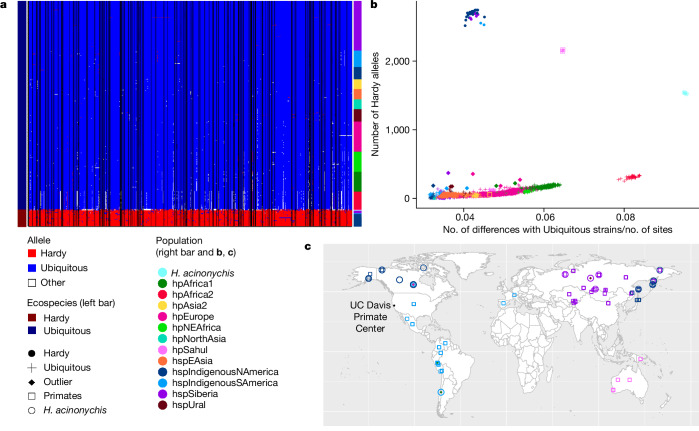
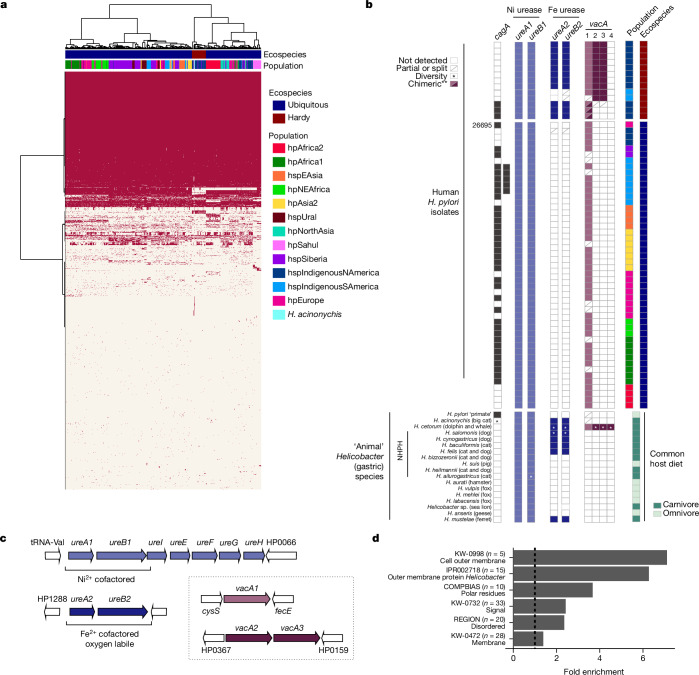
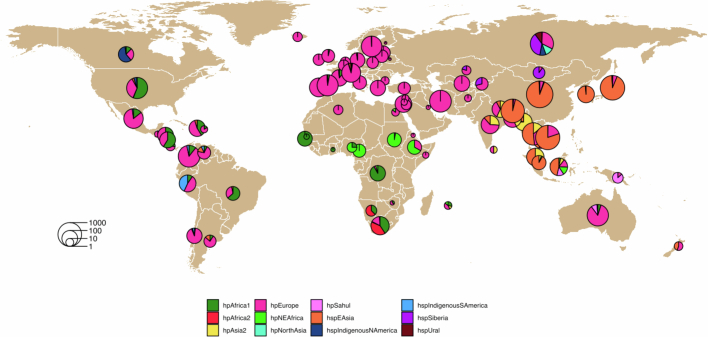
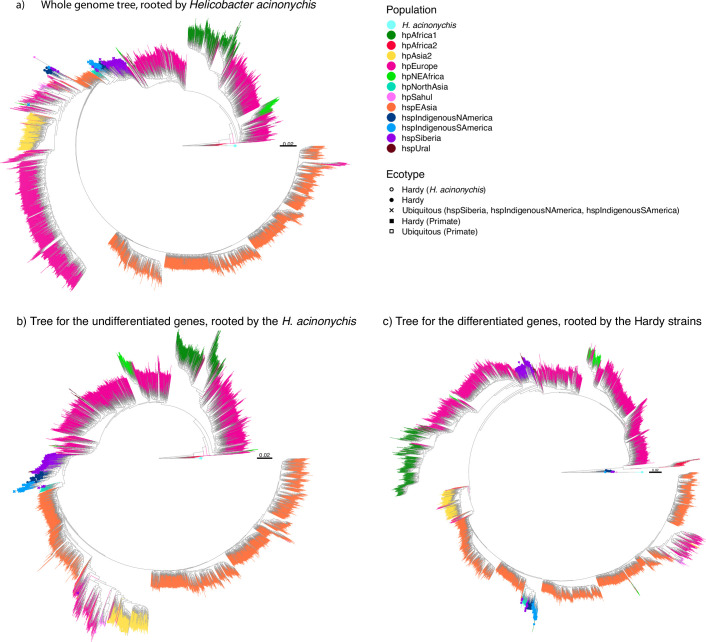
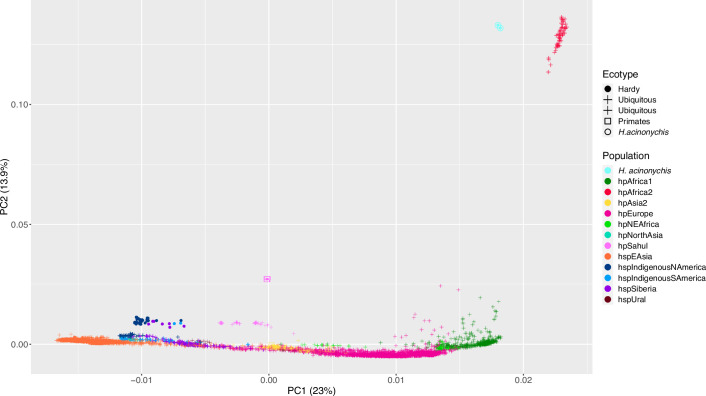
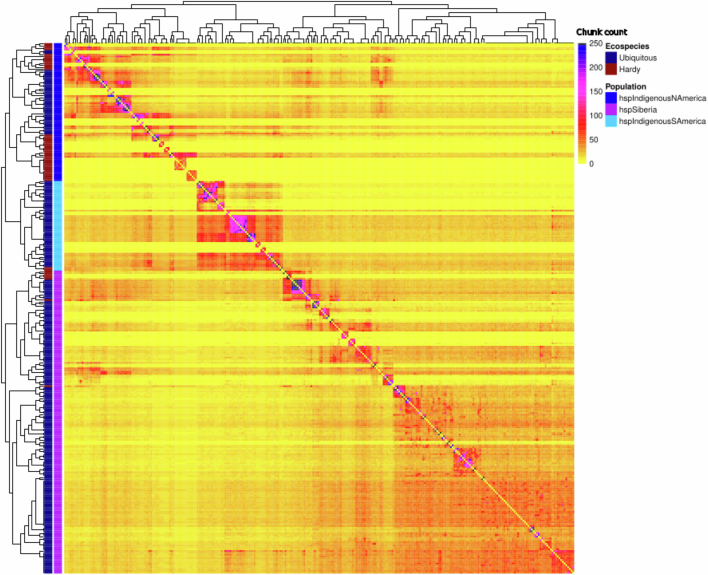
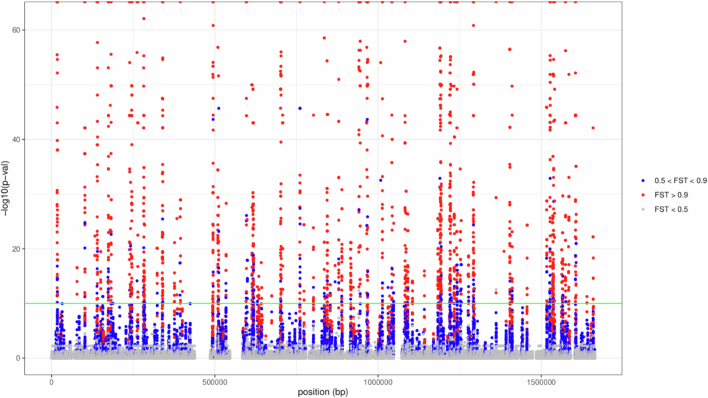
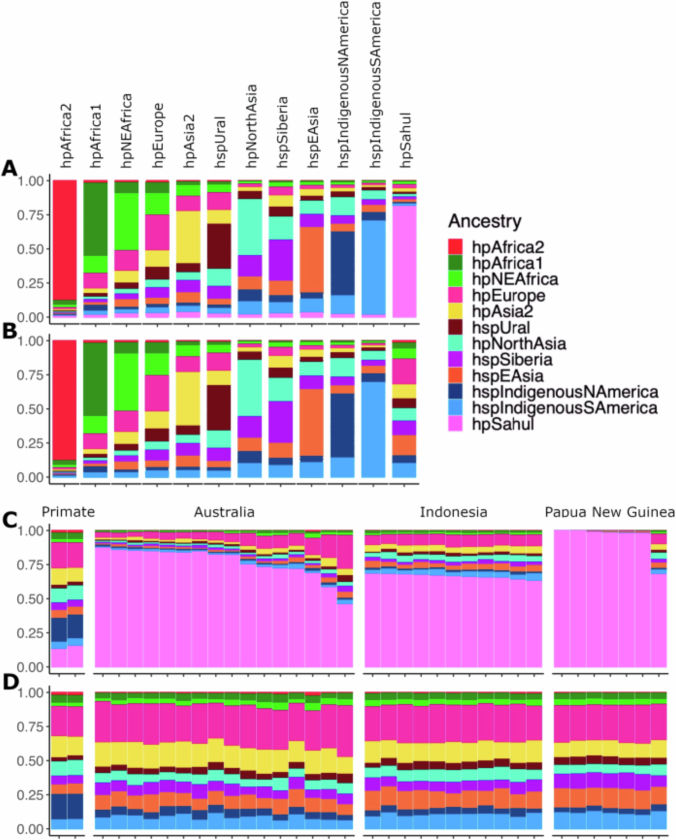
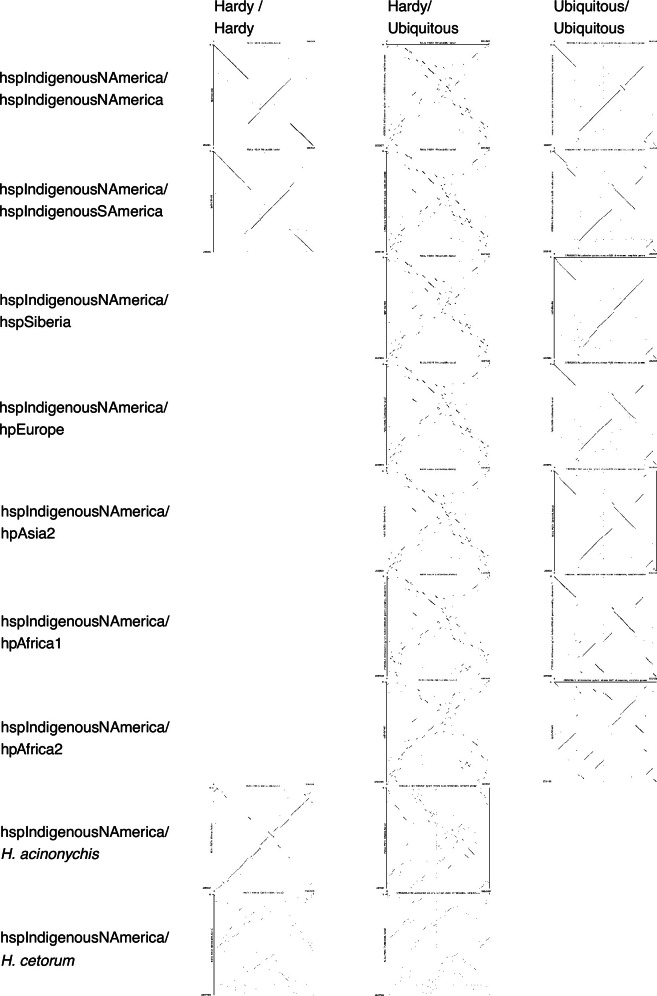
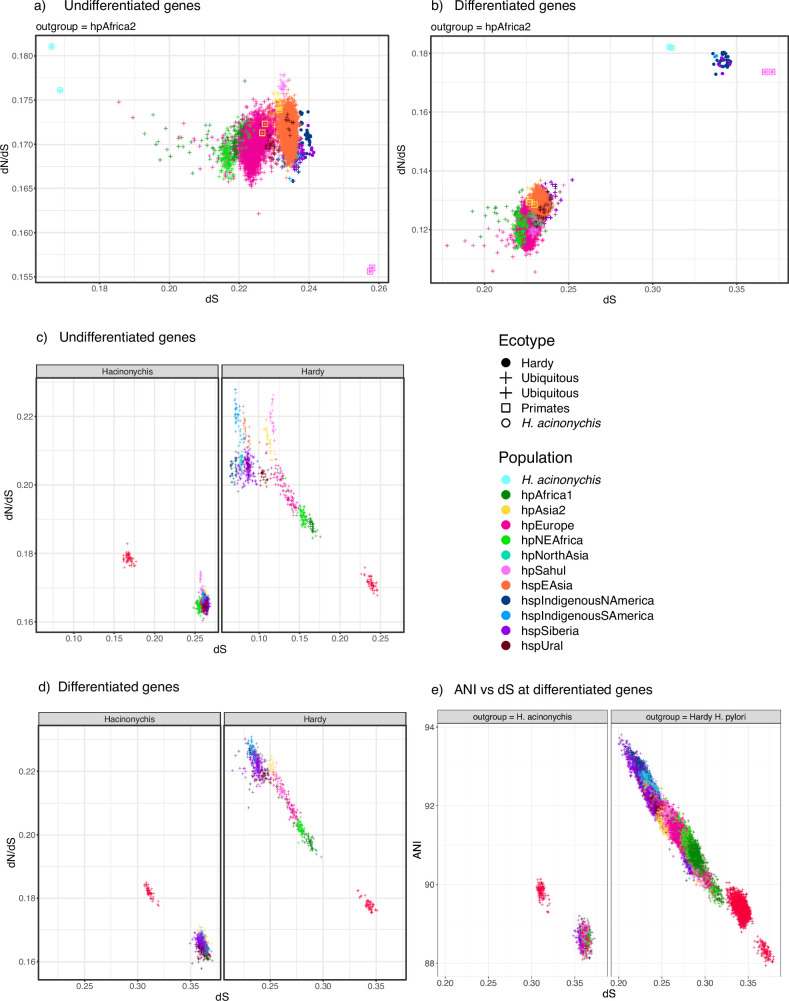
Helicobacter pylori disturbs the stomach lining during long-term colonization of its human host, with sequelae including ulcers and gastric cancer1,2. Numerous H. pylori virulence factors have been identified, showing extensive geographic variation1. Here we identify a 'Hardy' ecospecies of H. pylori that shares the ancestry of 'Ubiquitous' H. pylori from the same region in most of the genome but has nearly fixed single-nucleotide polymorphism differences in 100 genes, many of which encode outer membrane proteins and host interaction factors. Most Hardy strains have a second urease, which uses iron as a cofactor rather than nickel3, and two additional copies of the vacuolating cytotoxin VacA. Hardy strains currently have a limited distribution, including in Indigenous populations in Siberia and the Americas and in lineages that have jumped from humans to other mammals. Analysis of polymorphism data implies that Hardy and Ubiquitous coexisted in the stomachs of modern humans since before we left Africa and that both were dispersed around the world by our migrations. Our results also show that highly distinct adaptive strategies can arise and be maintained stably within bacterial populations, even in the presence of continuous genetic exchange between strains.


Conflict of interest statement

The authors declare no competing interests.

Figures

Fig. 1
Fig. 1. Differentiation between Hardy and Ubiquitous strains is localized in the genome.
a, Manhattan plot from GWAS analysis of Hardy versus Ubiquitous strains from hspSiberia and hspIndigenousNAmerica (zoomed in between 1.50 and 1.55 megabase pairs; full plot shown in Extended Data Fig. 5). Genes are indicated by blue and red (differentiated genes) arrows. Green line indicates significance threshold (−log10(P) = 10, which is based on a Bayesian Wald test with a Bonferroni correction for multiple testing, using a significance threshold before correction of 3 × 10–5, and 285,792 tested SNPs). Points are coloured based on FST (fixation index) values; half-points at the top of the plot indicate estimated P = 0 and FST = 1. HP1445 and so on are H. pylori genes based on the annotation of the 26695 strain. b,c, Phylogenetic trees for undifferentiated (b) and differentiated (c) genes from a representative subset of strains (see Extended Data Fig. 2b,c for trees of the whole dataset). Branches are coloured based on population. Strains from the Hardy clade are indicated by a filled circle at the end of the branch.
Fig. 2
Fig. 2. Divergence and spread of Hardy and Ubiquitous gene pools.
a, Hypothesized scenario for the differentiation of H. pylori into two ecospecies and subsequent global spread (not to scale). Thick grey tree represents a simplified history of human population differentiation (based on ref. ). Helicobacter evolution is represented by thinner lines, which are within the grey tree during periods of evolution in humans. Green line represents H. pylori before the evolution of the two ecospecies; blue line represents Ubiquitous ecospecies; red line represents Hardy ecospecies; dotted red lines indicate that Hardy strains have not yet been detected on the branch and therefore may have gone extinct. b, Phylogenetic population trees for differentiated (Hardy in red and Ubiquitous in blue) and undifferentiated (in grey) regions of the genomes. Trees were constructed considering only populations with both Hardy and Ubiquitous representatives. Pairwise distances between strains were calculated for the relevant genome regions, and population distances were calculated by averaging over pairwise strain distances. For Africa, we used H. acinonychis strains for the Hardy differentiated gene trees and hpAfrica2 strains for the Ubiquitous differentiated gene tree. For the undifferentiated gene tree, we averaged over the relevant Hardy and Ubiquitous strains.
Fig. 3
Fig. 3. Geographic distribution of Hardy and Ubiquitous haplotypes.
a, Haplotypes at the SNPs that are differentiated between the two ecospecies for hspSiberia and hspIndigenousNAmerica strains, and randomly selected representatives from other populations. The major Hardy allele is represented in red and the major Ubiquitous allele in blue; other alleles are shown in white. Black vertical lines separate different genes. b, Number of Hardy alleles as a function of average genetic distance with Ubiquitous ecospecies strains from hspIndigenousSAmerica, hspSiberia and hspIndigenousNAmerica. Dots are coloured based on their populations with Ubiquitous strains represented by crosses and Hardy strains represented by circles. Filled diamonds indicate Ubiquitous outlier strains with a higher number of Hardy alleles than expected for a strain at that genetic distance. c, Map showing location of Hardy (circles) and Ubiquitous (squares) strains from hspIndigenousSAmerica, hspSiberia, hspIndigenousNAmerica and hpSahul populations, as well as strains that were outliers (filled diamonds) compared with their population in the number of Hardy alleles they have. For some strains, information on where they were isolated (latitude and longitude) was missing, in which case we entered the coordinates of their country of isolation.
Fig. 4
Fig. 4. Genome composition in human and animal Helicobacter.
a, Hierarchical clustering based on pangenome presence (red)/absence (white) for a sample of the global dataset. Strains are coloured based on their population and ecospecies. b, Top, presence/absence of cagA and different vacA and ureA/B types in Hardy and Ubiquitous H. pylori from humans. Included is a subset of complete genomes, two cagA+ Hardy strains and reference strain 26695. Bottom, presence/absence in gastric Helicobacter isolated from animals. Common host(s) and their diets are indicated (Supplementary Table 4). c, Representative configuration and genomic context of ureA/B and vacA in Hardy H. pylori genomes, based on strain HpGP-CAN-006. Lighter-coloured arrows indicate genes present in both ecospecies, based on sequence and genomic context/synteny; darker-coloured arrows indicate Hardy-specific versions. d, Fold enrichment for significant (P < 0.05, one-sided Fisher’s test, Benjamini correction) functional terms. Chimeric, potential chimeric version (Hardy + Ubiquitous); Diversity, differential presence/absence in analysed genomes within the species; NHPH. non-H. pylori Helicobacter spp.; tRNA, transfer RNA.
Extended Data Fig. 1
Extended Data Fig. 1. Origin of the different strains of our global dataset.
The size of the pie charts shows the number of isolates from the country, with areas scaling logarithmically with sample size. The pie charts show the proportion of isolates assigned to each H. pylori population.
Extended Data Fig. 2
Extended Data Fig. 2. Phylogenetic trees for all strains in the dataset.
The branches are coloured based on their population. Hardy strains are represented with a circle while the other strains from the same populations are represented with a cross. The primate strains are represented with squares. Phylogenetic trees for all the genes (A). Some strains from hspIndigenousNAmerica, hspIndigenousSAmerica and hspSiberia do not cluster with their expected population. For undifferentiated genes (B) and for the differentiated genes (C). The branches are coloured based on the population and the strains from the Hardy clade are indicated with a dot.
Extended Data Fig. 3
Extended Data Fig. 3. First two components of the Principal Components Analysis (PCA) from the entire dataset.
Strains are coloured based on their population and the strains from the Hardy ecospecies are represented by a dot while the crosses represent Ubiquitous strains. Squares and circles respectively indicate primate and H. acinonychis strains.
Extended Data Fig. 4
Extended Data Fig. 4. FineSTRUCTURE analysis of the strains from hspSiberia, hspIndigenousNAmerica and hspIndigenousSAmerica.
The strains from the Hardy clade are highlighted by red shading, overlaying the dendrogram on the left of the plot, while the Ubiquitous strains are highlighted with blue. FineSTRUCTURE uses an in silico chromosome painting algorithm to fit each strain as a mosaic of nearest neighbours, chosen from the other strains in the dataset. Each row shows the coancestry vector for one strain, which is a count of the number of segments of DNA used in the painting from each of the other strains in the dataset. High coancestry between strains implies that they are nearest neighbours for many segments of the genome and hence share genetic material from a common gene pool. FineSTRUCTURE based clustering is more sensitive to recent gene flow than clustering using genetic distances.
Extended Data Fig. 5
Extended Data Fig. 5. Manhattan plot resulting from a GWAS analysis of the Hardy vs Ubiquitous strains from hspSiberia and hspIndigenousNAmerica.
The green line represents the significance threshold (-log10(p) = 10, bayesian Wald test with a correction for multi-testing giving a significance threshold equals to α/nsnps = 0.05/285,792). Points are coloured based on FST (fixation index between Hardy and Ubiquitous ecospecies) values (red: FST > 0.9, blue: FST 0.5 − 0.9, grey: FST < 0.5). Half points at the top of the plot indicate an estimated p-value of zero and FST of one.
Extended Data Fig. 6
Extended Data Fig. 6. Average ancestry profiles of Global H. pylori.
(A) With hpSahul donors and (B) without hpSahul donors. Close-up of Hardy primates and hpSahul strains (C) with hpSahul donors and (D) without hpSahul donors. Although the primate strains do not correspond to any hpSahul strains present in the data (based on their ancestry profile in the presence of an hpSahul donor), they can still be assigned to hpSahul (based on their ancestry profile without an hpSahul donor).
Extended Data Fig. 7
Extended Data Fig. 7. Dot plot comparisons between genomes within and between ecospecies.
The genomes of two hspIndigenousNAmerica, one Hardy and one Ubiquitous strain were plotted against the genome of strains more or less distantly related, from left to right: hspIndigenousNAmerica, hspIndigenousSAmerica, hspSiberia, hpAsia2, hpEurope, hpAfrica1, hpAfrica2, H. acinonychis and H. cetorum; and from top to bottom: Hardy vs Hardy strains, Hardy vs Ubiquitous strains and Ubiquitous vs Ubiquitous strains. Comparison between identical genomes would give single diagonal line, with breaks indicating rearrangements and differences in genome content. The presence of several small lines indicates that there are many rearrangements between the two genomes being compared. On the contrary, comparisons with long lines means highly similar genomes. For more details on how the comparisons were made, see the paragraph “Genome structure comparison” in the Method section.
Extended Data Fig. 8
Extended Data Fig. 8. Pairwise dN/dS values to relevant outgroups.
dN/dS vs dS (A,B) dN/dS vs dS between the different populations (hpAfrica2 excluded) and hpAfrica2 for the undifferentiated (A) and differentiated (B) genes. Thus, all comparisons involve hpAfrica2 strains and the dots are coloured based on the non-hpAfrica2 population. In addition, the shape represents the ecospecies of the non-hpAfrica2 strain, the dots represent Hardy strains while the crosses represent the Ubiquitous strains; the primates and H. acinonychis strains are indicated with squares and circles, respectively. (C,D) dN/dS vs dS between the Ubiquitous and Hardy strains for the undifferentiated (C) and differentiated (D) genes (subplots based on whether the Hardy strains were H. acinonychis or non-H. acinonychis). For the C and D subplots, all comparisons involve one Hardy (H. acinonychis or non-H. acinonychis) and one Ubiquitous strain, and the dots are coloured based on the Ubiquitous strain population. In all cases, each dot represents the value for a non-outgroup strain, averaged over their values when compared against the different outgroup strains (the outgroups are hpAfrica2 for subplots A and B and H. acinonychis or Hardy H. pylori for subplots C and D). (E) Relationship between dS and Average Nucleotide Identity (ANI) for the same comparisons as shown in panel D.
Extended Data Fig. 9
Extended Data Fig. 9. Number of Hardy alleles per strain against the number of Hardy blocks.
The dots represent the Hardy strains, and the points are coloured based on their population. The outliers from Fig. 3b are shown with a diamond. The primate and H. acinonychis strains are indicated by squares and circles, respectively.

References

    1. Suerbaum, S. & Michetti, P. Helicobacter pylori infection. N. Engl. J. Med.347, 1175–1186 (2002). - PubMed
    1. Amieva, M. & Peek, R. M. Jr. Pathobiology of Helicobacter pylori-induced gastric cancer. Gastroenterology150, 64–78 (2016). - PMC - PubMed
    1. Kersulyte, D. et al. Complete genome sequences of two Helicobacter pylori strains from a Canadian Arctic Aboriginal community. Genome Announc. 10.1128/genomeA.00209-15 (2015). - PMC - PubMed
    1. Eppinger, M. et al. Who ate whom? Adaptive Helicobacter genomic changes that accompanied a host jump from early humans to large felines. PLoS Genet.2, e120 (2006). - PMC - PubMed
    1. Ailloud, F. et al. Within-host evolution of Helicobacter pylori shaped by niche-specific adaptation, intragastric migrations and selective sweeps. Nat. Commun.10, 2273 (2019). - PMC - PubMed

MeSH terms

LinkOut - more resources