. 2024 Jun;23(3):887-895.
doi: 10.1007/s12311-023-01546-0. Epub 2023 Mar 31.

SCAview: an Intuitive Visual Approach to the Integrative Analysis of Clinical Data in Spinocerebellar Ataxias

Collaborators, Affiliations

SCAview: an Intuitive Visual Approach to the Integrative Analysis of Clinical Data in Spinocerebellar Ataxias

Mischa Uebachs et al. Cerebellum. 2024 Jun.

Abstract

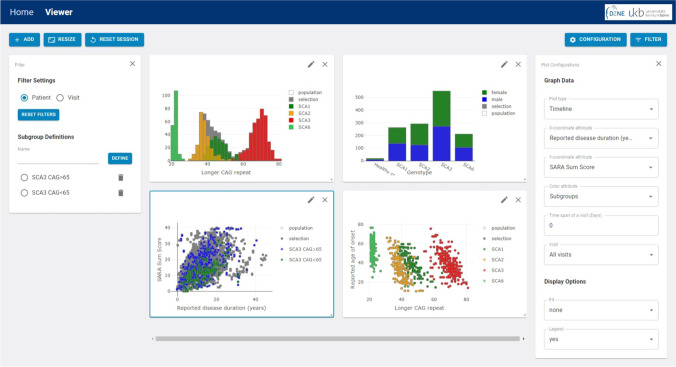
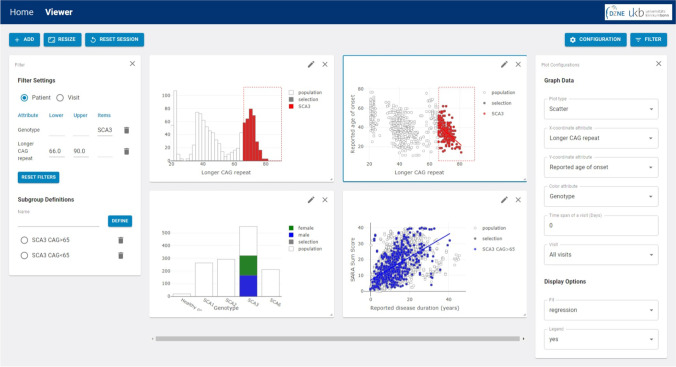
With SCAview, we present a prompt and comprehensive tool that enables scientists to browse large datasets of the most common spinocerebellar ataxias intuitively and without technical effort. Basic concept is a visualization of data, with a graphical handling and filtering to select and define subgroups and their comparison. Several plot types to visualize all data points resulting from the selected attributes are provided. The underlying synthetic cohort is based on clinical data from five different European and US longitudinal multicenter cohorts in spinocerebellar ataxia type 1, 2, 3, and 6 (SCA1, 2, 3, and 6) comprising > 1400 patients with overall > 5500 visits. First, we developed a common data model to integrate the clinical, demographic, and characterizing data of each source cohort. Second, the available datasets from each cohort were mapped onto the data model. Third, we created a synthetic cohort based on the cleaned dataset. With SCAview, we demonstrate the feasibility of mapping cohort data from different sources onto a common data model. The resulting browser-based visualization tool with a thoroughly graphical handling of the data offers researchers the unique possibility to visualize relationships and distributions of clinical data, to define subgroups and to further investigate them without any technical effort. Access to SCAview can be requested via the Ataxia Global Initiative and is free of charge.

Keywords: Observational studies; Spinocerebellar ataxia (SCA); Visualization.


Conflict of interest statement

Dr. Klockgether is receiving research support from the Bundesministerium für Bildung und Forschung (BMBF), the National Institutes of Health (NIH) and Servier. Within the last 24 months, he has received consulting fees from Biogen, UCB, and Vico Therapeutics. Dr. Ashizawa receive NIH grants U01NS104326, R01NS115002, and R01NS124065. Dr. Ashizawa also received grants from the National Ataxia Foundation (NAF), and participated in Biohaven 201 and 206 clinical trials. Dr. Kuo is funded by the National Institutes of Health. Dr. Kuo serves as scientific advisor for Praxis Precision Medicine, Sage Therapeutics, Neurocrine Biosciences, and Reata Pharmaceuticals. Dr. Faber receives funding as a fellow of the Hertie Network of Excellence in Neuroscience and from the National Ataxia Foundation (NAF). All other authors have no competing interests.

Figures

Fig. 1
Fig. 1
Example Screenshot of SCAview. On the left side one can see the filter-setting window, in the middle section, four examples for the different plot types available are depicted and on the right side the configuration window for the actual plot is displayed (here left bottom scatter plot, marked with a blue outline). The plot in the upper left corner shows a histogram of the CAG length of the longer allele with the genotype as additional color-coded attribute. The right upper corner shows a bar plot of each genotype with sex as color-coded additional attribute. In the left bottom corner, a timeline plot of SARA sum score versus reported disease duration displays two subgroups that were previously defined by filter settings: SCA3 mutation carriers with a CAG repeat length of more and those with less than 65 CAGs of the longer allele. The example plot on the right bottom corner shows a scatter plot of the reported age of onset versus CAG repeats on the longer allele, again with the genotype as additional color-coded attribute
Fig. 2
Fig. 2
Shown here is an example screenshot of plot types in SCAview with the applied graphically defined filtering of (i) SCA3 (box selection in the bottom left plot) + (ii) CAG > 65 (box selection in the upper left plot). The bar and timeline plots of the bottom row are the same as in Fig. 1 (right upper corner and left bottom corner). Notably, now only the selected subcohort defined by filter settings of “SCA3 + CAG > 65” is depicted with the entire population shadowed in the background

References

    1. Ashizawa T, Figueroa KP, Perlman SL, et al. Clinical characteristics of patients with spinocerebellar ataxias 1, 2, 3 and 6 in the US; a prospective observational study. Orphanet J Rare Dis. 2013;8:177. doi: 10.1186/1750-1172-8-177. - DOI - PMC - PubMed
    1. Jacobi H, Bauer P, Giunti P, et al. The natural history of spinocerebellar ataxia type 1, 2, 3, and 6: a 2-year follow-up study. Neurology. 2011;77:1035–1041. doi: 10.1212/WNL.0b013e31822e7ca0. - DOI - PMC - PubMed
    1. Jacobi H, du Montcel ST, Bauer P, et al. Long-term disease progression in spinocerebellar ataxia types 1, 2, 3, and 6: a longitudinal cohort study. Lancet Neurol. 2015;14:1101–1108. doi: 10.1016/S1474-4422(15)00202-1. - DOI - PubMed
    1. Jacobi H, du Montcel ST, Romanzetti S, et al. Conversion of individuals at risk for spinocerebellar ataxia types 1, 2, 3, and 6 to manifest ataxia (RISCA): a longitudinal cohort study. Lancet Neurol. 2020;19:738–747. doi: 10.1016/S1474-4422(20)30235-0. - DOI - PubMed
    1. Jacobi H, Hauser TK, Giunti P, et al. Spinocerebellar ataxia types 1, 2, 3 and 6: the clinical spectrum of ataxia and morphometric brainstem and cerebellar findings. Cerebellum. 2012;11:155–166. doi: 10.1007/s12311-011-0292-z. - DOI - PubMed