. 2025 Sep;645(8081):702-711.
doi: 10.1038/s41586-025-09255-w. Epub 2025 Jul 23.

A generic non-invasive neuromotor interface for human-computer interaction

Collaborators, Affiliations

A generic non-invasive neuromotor interface for human-computer interaction

Patrick Kaifosh et al. Nature. 2025 Sep.

Abstract

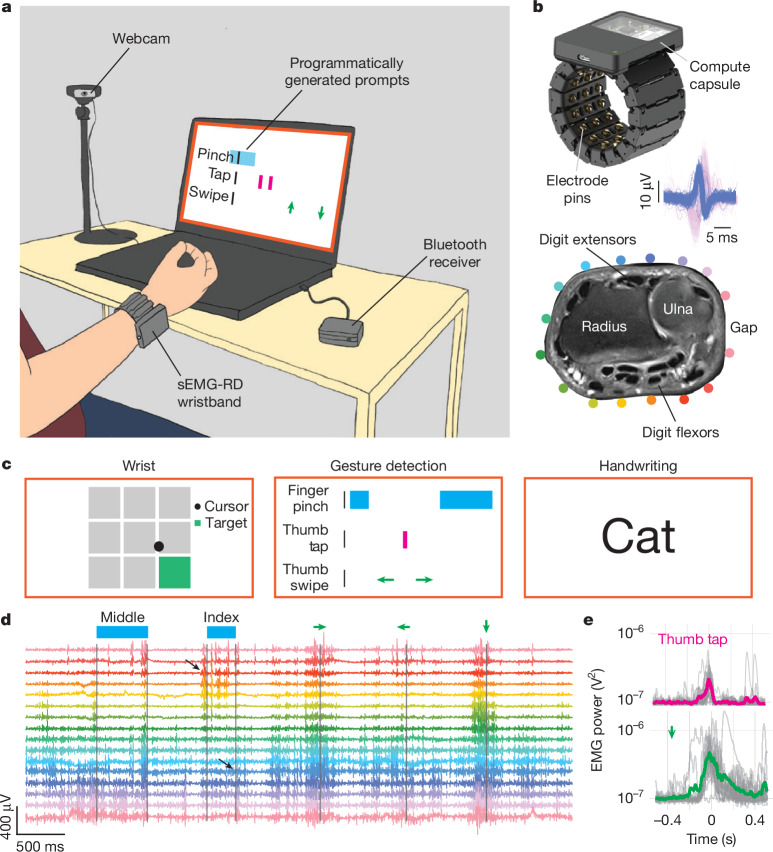
Since the advent of computing, humans have sought computer input technologies that are expressive, intuitive and universal. While diverse modalities have been developed, including keyboards, mice and touchscreens, they require interaction with a device that can be limiting, especially in on-the-go scenarios. Gesture-based systems use cameras or inertial sensors to avoid an intermediary device, but tend to perform well only for unobscured movements. By contrast, brain-computer or neuromotor interfaces that directly interface with the body's electrical signalling have been imagined to solve the interface problem1, but high-bandwidth communication has been demonstrated only using invasive interfaces with bespoke decoders designed for single individuals2-4. Here, we describe the development of a generic non-invasive neuromotor interface that enables computer input decoded from surface electromyography (sEMG). We developed a highly sensitive, easily donned sEMG wristband and a scalable infrastructure for collecting training data from thousands of consenting participants. Together, these data enabled us to develop generic sEMG decoding models that generalize across people. Test users demonstrate a closed-loop median performance of gesture decoding of 0.66 target acquisitions per second in a continuous navigation task, 0.88 gesture detections per second in a discrete-gesture task and handwriting at 20.9 words per minute. We demonstrate that the decoding performance of handwriting models can be further improved by 16% by personalizing sEMG decoding models. To our knowledge, this is the first high-bandwidth neuromotor interface with performant out-of-the-box generalization across people.


Conflict of interest statement

Competing interests: All contributors are current or former employees of Meta Platforms, Inc.

Figures

Fig. 1
Fig. 1. A hardware and software platform for high-throughput recording and real-time decoding of sEMG at the wrist.
a, Overview of sEMG data collection. A participant wears the sEMG wristband, which communicates with a computer through a Bluetooth receiver. The participant is prompted to perform diverse movements of the hand and wrist. A webcam captures their hand and wrist, excluding the face. Between sessions within a single day, the participants remove and slightly reposition the sEMG wristband to enable generalization across different recording positions. b, The sEMG wristband consists of 48 electrode pins configured into 16 bipolar channels with the sensing axis aligned with the proximal–distal axis of the forearm and the remainder serving as shield and ground electrodes (top). A 3D printed housing encloses cabling and analogue amplifiers for each channel. A compute capsule digitizes the signal and streams sEMG data using Bluetooth. Inset: overlay of 62 and 72 individual instances of two putative MUAPs evoked by subtle thumb (blue) and pinky extension (pink) movements, respectively, from a single sEMG channel (Methods). Bottom, a proton-density-weighted axial plane magnetic resonance imaging (MRI) scan of the wrist; relevant bone and muscle landmarks are labelled. The coloured dots indicate the approximate position of electrodes, with an adjustable gap between electrodes placed over an area of low muscle density. c, Schematic of the prompters for the three tasks (Methods and Extended Data Fig. 4). In the wrist task, the participants controlled a cursor using wrist movements tracked in real time with motion capture. In the discrete-gesture task, gesture prompts scrolled from right to left. In the handwriting task, the participants wrote words presented on the screen. d, Representative sEMG signals, high-pass filtered at 20 Hz, recorded during performance of discrete gestures reveal intricate patterns of activity across multiple channels accompanying each gesture, with prompt timings above (for example, ‘middle’ indicates middle pinch, and the green left arrow indicates a leftward thumb swipe). Channel colouring corresponds to electrode locations in b. The black arrows highlight activation of flexors and extensors during an index-to-thumb pinch and release, respectively. e, Representative examples of variability in gestural sEMG activations across gesture instances (thumb taps (top) and downward thumb swipe (bottom)). The grey lines show the instantaneous high-pass-filtered sEMG power, summed across channels, for all instances of a gesture during a single band placement. The bold traces show the average. The mean was subtracted from all traces, and the power was offset by 10−7 V2 to plot on a logarithmic scale without visually exaggerating the baseline variance.
Fig. 2
Fig. 2. Generalization performance of single-participant and multi-participant models.
a, Cross-participant (columns) and cross-session variability (light lines) in gestural sEMG for four discrete gestures (different rows and colours) across seven participants. Four of the possible nine gestures are shown for clarity. The light lines show the high-pass-filtered sEMG power averaged across all channels and all gesture instances during a single band placement. The bold lines correspond to the average across all band placements. b, t-SNE embedding of sEMG activations (Methods) across participants for the four different gestures in a. Gesture colour map as in a, with shading reflecting different participants (n = 20). Each dot reflects an individual gestural instance. c,d, Single-participant models trained and tested on the same participant (c) or different participants (d). Generalization across sessions improves as more training data are used. Generalization across participants remains poor even when more training data are used. Statistical analysis was performed using two-sided Wilcoxon signed-rank tests; all pairwise comparisons are significant; P < 10−10. n = 100 single-participant models. The boxes show the median (centre line) and lower and upper quartiles (box limits), and the whiskers extend to ±1.5 × interquartile range. eg, The decoding error of models trained to predict wrist angle velocity (e), classify nine discrete gestures (f) and classify handwritten characters (g) as a function of the training set size. Data are the mean ± s.e.m. decoding error evaluated on a test set of held-out participants (n = 22 for wrist, 100 for discrete gestures and 50 for handwriting) (Methods). The dashed lines and inset equations show fitted scaling curves (N is measured in units of hundreds of participants and D in millions of parameters). For discrete gestures, the open circle represents varying numbers of sessions per participant (Methods).
Fig. 3
Fig. 3. Generic sEMG decoding models enable closed-loop control in diverse interactions.
ac, Schematics of the three closed-loop tasks. a, Horizontal cursor (wrist): the participants control a cursor (red circle) to acquire a target (green rectangle) in a row of possible targets (grey rectangles). b, Discrete grid navigation: the participants use thumb swipe gestures to navigate, and perform activation gestures prompted by coloured shapes. c, Text entry: the participants handwrite prompted text. (Methods, Extended Data Fig. 7 and Supplementary Videos 1–3). d,e, The performance of n = 17 naive test participants using the wrist decoder in the horizontal cursor task. d, The mean target-acquisition time (excluding the 500 ms hold) in each task block. e, The mean dial-in time in trials in which the cursor prematurely exited the target before completing the hold. Inset: the fraction of trials with premature exits. The dashed red and orange lines in panels e and d show the median task performance with the ground truth wrist angles measured by motion capture (n = 162, with no previous task exposure) and with the native MacBook trackpad (n = 17, with previous task exposure), respectively (Methods). fh, The performance of n = 24 naive test participants using the discrete-gesture decoder in the grid navigation task. f, The fraction of prompted gestures in each block for which the first detected gesture matches the prompt (first-hit probability). g, The mean gesture completion rate in each task block. The dashed red lines in panels f and g show the median task performance of a different set of n = 23 participants using a gaming controller (Methods). h, Confusion rates (normalized to expected gestures) in evaluation blocks, averaged across participants. Early release denotes a hold of less than 500 ms. i,j, The performance of n = 20 naive test participants using the handwriting decoder on the text entry task. i, The online CER in each block. j, The WPM in each block. The dashed red line shows the median WPM of a different set of n = 75 participants handwriting similar phrases in open loop without a pen (Methods). For each participant, the online CER and WPM are calculated as the median over trials in each block. For all panels, statistical analysis was performed using two-tailed paired sample Wilcoxon signed-rank tests; *P < 0.05, **P < 0.005; not significant (NS), P > 0.05. The boxes show the median (centre line) and lower and upper quartiles (box limits), and the whiskers extend to ±1.5 × interquartile range. The printed numbers show the median and outliers are marked with open circles. For each baseline device, the dashed lines show the median over participants and the shading shows the 95% confidence intervals estimated using the reverse percentile bootstrap with 10,000 resamples.
Fig. 4
Fig. 4. The discrete-gesture decoder learns representations that are physiologically grounded.
a, Schematic of network architecture. Conv1d denotes a 1D convolutional layer. The final linear readout and intermediate normalization layers are not shown (Methods). b, Representative convolutional filter weights (16 input channels × 21 timesteps) from the first layer of the trained model. c, Example heat maps of the normalized voltage across all 16 channels for putative MUAPs recorded with the sEMG wristband (Methods and Extended Data Fig. 2) after high-pass filtering (Methods). d,e, The frequency response of the channel with maximum power (d) and the root mean square (RMS) power per channel (e), both normalized to their respective peaks, for each example convolutional filter (blue lines) and putative MUAP (orange lines) from b and c, respectively (see also Extended Data Fig. 9). For comparison, the dashed black lines show these curves calculated over an entire recording session, averaged over ten randomly sampled sessions from the model training set. For d, we used the mean temporal frequency response over all 16 sEMG-RD channels. The sharp frequency response cut off at 40 Hz is from high-pass filtering (Methods). fh, Principal component analysis projection of LSTM representations of 500 ms sEMG snippets aligned with instances of each discrete gesture, from three participants held out from the training set, each with three different band placements. Each row shows the representation of each LSTM layer. Each column shows the same data, coloured by discrete gesture category (f), participant identity and band placement (g) or sEMG RMS power (h) at the time of the gesture. i, The proportion of total variance accounted for by each variable, for each layer (n = 50 test participants; Methods). Statistical analysis was performed using two-tailed paired sample t-tests; ***P < 0.001. The error bars (barely visible) show the 95% Student’s t confidence interval for the mean.
Fig. 5
Fig. 5. Personalization of generic sEMG handwriting models improves performance.
a, Schematic of the supervised handwriting decoder personalization. Predictions before and after personalization are shown above and below example prompts (such as ‘howdy!’) for two participants (left and right). The green and purple font denotes correct and incorrect character predictions, respectively. b, The mean performance (n = 40 test participants) of models pretrained on varying numbers of participants (red line) and fine-tuned on varying amounts of personalization data for each test participant (shades of blue). The dashed lines show power law fits (Methods). c, The relative reduction in offline CER that personalization provides beyond a given generic model, for varying amounts of pretraining participants and personalization data. The dashed lines show the relative improvements calculated from the power law fits in b. d, The relative increase in the number of pretraining participants that matches CER reduction from fine-tuning on varying amounts of personalization data (Methods), for generic models with varying amounts of pretraining participants. A value of 1 indicates doubling the number of pretraining participants. The dashed lines show the relative increases calculated from the power law fits in b. e, The relative reduction in offline CER (beyond the 60.2-million-parameter 6,527-participant pretrained generic model) achieved for each test participant (rows) by personalizing on 20 min of data from every other test participant (columns), sorted by the diagonal values. f, The relative reduction in CER achieved for each test participant (n = 40) by fine-tuning on 20 min of personalization data, as a function of the pretrained generic model CER for that test participant (60.2-million-parameter model), across various numbers of pretraining participants. Improvements from personalization are correlated with the CER of the pretrained generic model. We show the range of Pearson correlation coefficients across numbers of pretraining participants and the median P value (two-sided test); the maximum P value over all fits is 0.0035.
Extended Data Fig. 1
Extended Data Fig. 1. Schematic and anatomical interfacing of sEMG Research Device.
a, The sEMG Research Device electrical system architecture. The sEMG-RD uses 48 pogo-pin style round electrodes in order to provide good comfort and contact quality. The 48 channels are configured into 16 bipolar channels arranged proximo-distally, with the remainder electrodes serving as either shield or ground. Each electrode is 6.5 mm in diameter (gold plated brass). For each differential sensing channel (16 in total), centre-to-centre spacing between paired sensing electrodes is 20 mm. The sEMG-RD has low noise analog sensors with input-referred RMS noise of 2.46 μVrms, measured during benchtop testing with differential inputs shorted to their mid-point voltage. With analog sensors’ nominal gain value of 190 and Analog to Digital Converter’s (ADC) full-scale range of 2.5 V, the sEMG-RD offers a dynamic range of approximately 65.5 dB. Each channel is sampled at 2000 Hz. The Inertial Measurement Unit (IMU) functional block includes sensors of 3-axis accelerometer, 3-axis gyroscope, and 3-axis magnetometer sampled at 100 Hz. We note that the IMU was not utilized for any online or offline experiments described in this manuscript. The microcontroller facilitates the transfer of unprocessed data from all ADCs and IMU directly to the bluetooth radio. No skin preparation or gels are needed for using the sEMG-RD, because its analog sensors have very high input-impedance — approximately 10 pF capacitance in parallel with 10 TOhm resistance — providing excellent signal robustness against large variations of electrode-skin impedance among the population. b, Computer-aided design rendering of the sEMG-RD. The mechanical architecture consists of a kinematic chain with flexible joints connecting 16 pods that house the pogo-pin style electrodes that comprise the sEMG channels. This enables broad population coverage in maintaining consistent quality contact between the dry electrode and skin. Since each differential sensing channel is placed along the proximal-distal direction, the device is able to maintain symmetry with respect to wrist anatomy and provide generalizability across right and left hands, as long as the wearer keeps the gap location on the ulna side. c, Anatomical depiction of electrode locations relative to relevant muscle and skeletal landmarks, adapted from a public domain image. Pink overlays cover muscles that predominantly control the wrist, blue overlays cover muscles less involved in wrist control, red overlays cover blood vessels and yellow overlays cover nerves. The green diamond indicates the position of the electrode gap. Note the gap that arises between channels 0 and 15, due to variation in wrist circumference and elasticity between compartments, is aligned with the region of the wrist where the ulna is located.
Extended Data Fig. 2
Extended Data Fig. 2. Extraction and validation of putative MUAPs.
a-b, To evoke putative MUAPs, one participant followed a series of prompts instructing the execution of various low-force muscle contractions interspersed with periods of rest. To facilitate generating sparse and spatially focal EMG signals, the participant was provided visual feedback about the raw EMG on a manually selected channel during prompted rest (a) and movement (b) epochs. Each epoch lasted 10 s and was repeated three times. High-pass EMG on all channels (top) and on the manually selected channel (12) for visual feedback (middle) during a prompted rest epoch during data collection for putative thumb extension MUAPs. Grey vertical scale bars indicate 20 μV. MUAPs on any channel were detected using peak finding on the channel-averaged rectified and smoothed EMG (see Methods). The timings of detected MUAPs were used to construct a spike train capturing the activity of this multi-unit activity, whose instantaneous firing rate was computed by taking the inverse of each event’s interspike interval (ISI) in seconds (bottom). c, Mean instantaneous firing rates (computed as the total number of detected MUAPs over the epoch duration) during rest and movement epochs for each tested movement (IF: index flexion; MF: middle flexion; PE: pinky extension; TAb: thumb abduction; TE: thumb extension; WP: wrist pronation). Each sample corresponds to one prompt (rest or move) epoch. d, Coefficient of variation (CoV) during the prompted movement periods. CoV was computed as the standard deviation of interspike intervals (b; bottom) normalized by their mean. e, Multi-channel waveforms for putative MUAPs extracted during the prompted movement epochs for each action. For visualization, MUAPs for each movement were normalized by the 99.95th percentile of the absolute maximum (over samples and channels) of each MUAP. Thin lines correspond to individual MUAPs (total number detected indicated as n) and thick lines correspond to the median waveform over MUAPs for each movement. Each waveform is 20 ms long. Vertical scale bars indicate 20 uV. f, MUAP spatial profiles. The spatial profile for each MUAP was constructed using the peak-to-peak value of the waveform on each channel. The mean (solid line) and standard error (shading; nearly within solid lines) of the spatial profiles are shown for each movement. Angular locations represent approximate channel locations around the wrist (indicators) and the radii represent the peak-to-peak value.
Extended Data Fig. 3
Extended Data Fig. 3. Anthropometric and demographic features of sEMG datasets.
a, The number of participants in each corpus. b-e, Histograms of anthropometric characteristics of all participants (n = 11,236): (b) wrist circumference, (c) self-reported age, (d) BMI calculated from self-reported height and weight, and (e) self-reported height. The irregularity in the histogram of self-reported age is likely due to participants rounding their age to nearby values. We measured wrist circumferences with a standard measuring tape at the wrist just below the ulnar styloid process where the participants are expected to don the band. Values outside of the range of 10–30 cm were truncated. We calculated BMI as the weight (in kilograms) divided by height (in metres) squared. f-i, Distributions of the demographic characteristics across all participants (n = 11,236): (f) dominant handedness, (g) self-reported proficiency at typing on a computer keyboard, (h) self-reported gender, and (i) arm exercise frequency, chosen from one of the following options: Never (never), Less than once per week (rarely), 1-2 times per week (occasionally), more than twice per week (often).
Extended Data Fig. 4
Extended Data Fig. 4. Examples of prompting used to collect training data for the three tasks.
a, Time series of example prompter frames from the open-loop task used to collect training data for the wrist decoder. The participant was instructed to make wrist movements following a cursor (pink circle) making centre-out movements. For the user to be able to preempt the direction of the cursor movement, a line emanated out from the cursor to indicate the direction it was going to move to before subsequently moving. b, Time series of example prompter frames from the cursor-to-target closed-loop control task used to collect training data for the wrist decoder, with the 2D target configuration. In this task the participant was prompted to move the cursor to a highlighted target (light blue rectangle in panel labelled t0). When the cursor (red) landed on the target, a short timer began, marked by the black fill of the cursor and black border of the target region (panel t3). In this trial, the cursor was held on the target for 500 ms to complete the timer, so the target was acquired and therefore disappeared as the next target was prompted (light blue rectangle in panel t4). c, Example prompter from the smooth pursuit closed-loop control task used to collect training data for the wrist decoder. In this task the participant was instructed to move the cursor (red) to follow a target (black) moving in a randomly sampled smooth trajectory. d, Example of prompting for open-loop task used to collect training data for the discrete gesture recognizer. A series of gestures to be performed are depicted, with colours and labels corresponding to the gesture type. Gestures were separated by blank intervals in which no gesture was to be performed. Prompts scroll from the right of the screen to the left. Participants were instructed to perform each gesture when the corresponding prompt reached the indicator line (highlighted with an arrow) – either instantaneous gestures such as finger pinches or thumb swipes that are depicted as single lines, or held gestures such as index and middle holds that are depicted as solid bars. Participants were instructed to release held gestures when the indicator line reached the end of the rectangle. Gestures that have already been prompted are shown in grey. e, Detailed example of prompting during holds. At t0 an index hold gesture prompt appeared on the right side of the screen, with the time indicator line in white. At t1 the gesture prompt reached the time indicator, and the hold prompt changed colour to indicate the hold should be performed by the participant. At t2 the hold was no longer selected by the indicator bar and turned grey, indicating that the participant should release the hold. f, Example prompter shown during the handwriting task. The screen instructed the participant to write “how was your day” with their hand on the surface of the table, while seated. g, During the experimental session, different prompts, including numbers and punctuation, were shown, ranging from single characters to full sentences. Besides writing on a desk surface, the participant was also asked to perform handwriting on their leg while standing and on their leg while seated.
Extended Data Fig. 5
Extended Data Fig. 5. sEMG event similarities and single-participant sEMG decoder generalization performance.
a, Purple: cosine similarity between individual sEMG activations of a given gesture and the sEMG template (event-triggered average) for that gesture. From left to right: cosine similarities are plotted for all events within a single session (single band placement), across all sessions of a single participant, or across all sessions from all participants from Fig. 2a (100 sessions, 5 from each of 20 users). While similarity was relatively high within a single band placement, sEMG activations became progressively more distinct across different band placements and individuals. Orange: same, except for the cosine similarity of one gesture compared to the template for a distinct gesture. These were lower than similarity within the same gesture, irrespective of whether the grouping was done over a single band placement or across the population. Differences shown across sessions, participants and gestures are representative for all gestures and pairs of gestures. Boxes show median, lower quartile, and upper quartile, with whiskers extending to ±1.5×IQR. b, For each held-out individual, the fraction of other single-participant models in the discrete gesture detection task (Fig. 2c,d) that outperform that individual’s own model (i.e. had lower FNR). For all except two participants, none of the other single-participant models outperformed their own model. All the results in panels b-d are based on n = 100 single-participant models, each trained on 4 sessions from that participant. c, For each pair of participants, we computed the FNR of each participant’s model on data from every other participant. We embedded the resulting distance matrix in 2D using t-SNE. Qualitative inspection of t-SNE embeddings reveal no prominent similarity structure. d, Scatter plot comparing each person’s model’s average offline performance on every other participant’s data (donor FNR, x-axis) against the average performance of other participant’s models on that person’s held-out session (receiver FNR, y-axis). The dashed line shows x = y. There is not a significant Pearson correlation between the donor and receiver score (r = 0.11, p = 0.26, two-sided test, n = 100 participants). All models show high FNR, and the lack of correlation indicates that the generalizability of a given participant’s model to other individuals is not predictive of the other individual’s model’s generalizability to that participant.
Extended Data Fig. 6
Extended Data Fig. 6. Multivariate power frequency features improve wrist decoder performance over root mean square power features.
Decoding error of 4.4 M parameter wrist decoders trained to predict wrist angle velocity from MPF EMG features (black) or root mean square power EMG features (gold). Each dot shows mean +/- SEM decoding error evaluated on a fixed test set of held-out participants (n = 22), following the same conventions as in Fig. 2e. Asterisks below each pair of points indicate p < 10−4, two-tailed paired sample Wilcoxon signed-rank test. Root mean square power EMG features were calculated by first rescaling and high-pass filtering the EMG signal as in the MPF features (see Methods) and then taking the root mean square of each channel in a rolling window of length 200 samples (100 ms) strided by 40 samples (20 ms). The reduced dimensionality of these features (16 dimensions, as opposed to 384) implied a smaller number of input dimensions to the fully connected layer in the rotational-invariance module, which we compensated for by increasing the number of hidden dimensions from 512 to 600 to keep the total parameter count at 4.4 M.
Extended Data Fig. 7
Extended Data Fig. 7. Example screenshots of closed-loop evaluation tasks.
a, Screenshots from an example trial of 1D horizontal cursor control task, in which the participant was prompted to reach to the rightmost target (in panel labelled t0, light blue rectangle). When the cursor (red) landed on the target, the target was marked with a black border and a short timer began, marked by the black fill of the cursor (middle panel, t1). In this trial, the cursor was held on the target for 500 ms to complete the timer, so the target was acquired and therefore disappeared as the next target was prompted (right panel, t2). b, Screenshots from an example sequence in the discrete grid navigation task, in which the participant was prompted to perform (from left to right, marked as t0-t4): thumb swipe up, index hold, thumb swipe right, thumb swipe right, middle hold. c, Screenshots from an example trial in the handwriting task, in which the participant is prompted to write the phrase “example flashing red light means” (top) and the handwriting decoding model output in response to the participant’s behavior in the handwriting task (below).
Extended Data Fig. 8
Extended Data Fig. 8. Additional online evaluation metrics.
a, Mean Fitts’ law throughput on the 1D horizontal cursor control task. Throughput is defined as the index of difficulty divided by acquisition time, with the index of difficulty defined as in: log2(1+di/w), where di is the distance to the target at the start of trial i and w is the target width. Each box shows the distribution of trial-averaged throughput over participants (n = 17), following the same conventions as Fig. 3d,e. Throughput significantly improved from the practice block to the evaluation blocks (p < 0.005, two-tailed Wilcoxon signed-rank test), indicating learning effects consistent with the improvements in acquisition time and dial-in time shown in the main text. Dashed red line and shading shows median and 95% confidence interval of the performance of a different set of n = 162 participants controlling the cursor with ground truth wrist angles measured via motion capture (see Methods). Dashed orange line and shading shows median and 95% confidence interval of the performance of the same n = 17 participants controlling the cursor with MacBook trackpad (see Methods). For each baseline, confidence intervals for medians were calculated using the reverse percentile bootstrap. b-d, Performance on the discrete grid navigation task with Nintendo Switch Joy-Con controller (n = 23 participants). (b) Fraction of prompted gestures in each block in which the first gesture detected by the model was the correct one (out of 130 total prompted gestures in each block), as in Fig. 3f. This value was used as the baseline in Fig. 3f. (c) Mean gesture completion rate in each task block, as in Fig. 3g. This value was used as the baseline in Fig. 3g. (d) Discrete gesture confusion rates in evaluation blocks, averaged across participants, as in Fig. 3h. Confusion rates are expressed as a percent of instances in which the corresponding gesture was expected (across rows). Note that, despite using a commercially available and widely used controller, confusion rates remain non-zero, reflecting behavioural errors. e, Distribution of subjective impressions about the reliability of each EMG decoding model. At the end of each online evaluation task, participants were asked to respond to a multiple choice question about how reliably their intended action was detected. For the discrete gestures task, they were asked to answer this question separately for each of the thumb swipe directions and “activation” gestures. f-i, Demographics of participants that performed the online evaluation tasks for the wrist decoder (n = 17), discrete gestures decoder (n = 24), and handwriting decoder (n = 20): (f) self-declared gender, (g) self-declared dominant hand, (h) self-declared age, (i) measured wrist circumference. For all boxplots, boxes show median, lower quartile, and upper quartile, with whiskers extending to ±1.5×IQR. Any values beyond these are marked with open circles. One and two asterisks respectively indicate p < 0.05 and p < 0.005, and “ns” indicates “not significant” (p > 0.05); two-tailed paired sample Wilcoxon signed-rank test.
Extended Data Fig. 9
Extended Data Fig. 9. Spatiotemporal properties of all discrete gesture decoder convolutional filters.
a, Index of channel with max root mean square (RMS) power (n = 512 convolutional filters). Here and in all other panels in this figure, the triangles at the top mark the values of the 6 example convolutional filters from Fig. 4b (blue triangles) and the 6 example putative MUAPs from Fig. 4c (orange triangles). b, Number of channels with RMS power within 50% of the peak channel. c, Peak frequency response of the channel with max RMS power. d, Bandwidth of the channel with max RMS power (see Methods).
Extended Data Fig. 10
Extended Data Fig. 10. Influence of early stopping during personalization.
In this figure, we employ early stopping during personalization to disambiguate the role of more personalization data from increased fine-tuning iterations as well as to mitigate regressions among the best-performing users. Specifically, we used mean CER on held out test data as a selection criteria for epoch-wise early stopping. Aside from early stopping, the setup here is identical to that in Fig. 5b,e,f) of the main text. Overall, results are very similar to Fig. 5 of the main text, indicating that the increase in personalization data is the primary driver of improved performance. Regressions among the best-performing users are now absent. Note also that we do not have separate validation and test sets, so these results should be understood as validation performance. a, Same as Fig. 5b of the main text, except with the inclusion of early stopping during fine-tuning. b, Same as Fig. 5e of the main text, except with the inclusion of early stopping during fine-tuning. Compared with Fig. 5e, transfer of personalized models to other participants yields overall smaller regressions likely because early-stopped models remain closer to the pre-trained model. c, Same as Fig. 5f of the main text, except with the inclusion of early stopping during fine-tuning. Regressions exhibited by a few of the best performing users in Fig. 5f are now absent due to early stopping. We show the range of Pearson correlation coefficients for each fit and the median p-value (two-sided test); maximum p-value over all fits is 0.020.

References

    1. Battye, C. K., Nightingale, A. & Whillis, J. The use of myo-electric currents in the operation of prostheses. J. Bone Joint Surg. Br.37-B, 506–510 (1955). - PubMed
    1. Hochberg, L. R. et al. Reach and grasp by people with tetraplegia using a neurally controlled robotic arm. Nature485, 372–375 (2012). - PMC - PubMed
    1. Collinger, J. L. et al. High-performance neuroprosthetic control by an individual with tetraplegia. Lancet381, 557–564 (2013). - PMC - PubMed
    1. Willett, F. R. et al. A high-performance speech neuroprosthesis. Nature620, 1031–1036 (2023). - PMC - PubMed
    1. Gilja, V. et al. A high-performance neural prosthesis enabled by control algorithm design. Nat. Neurosci.15, 1752–1757 (2012). - PMC - PubMed

LinkOut - more resources