

Neuropsychological dysfunction and neuroimaging abnormalities in neurologically intact adults with sickle cell anemia
- PMID: 20460621
- PMCID: PMC2892214
- DOI: 10.1001/jama.2010.562
Neuropsychological dysfunction and neuroimaging abnormalities in neurologically intact adults with sickle cell anemia
Abstract
Context: Sickle cell anemia (SCA) is a chronic illness causing progressive deterioration in quality of life. Brain dysfunction may be the most important and least studied problem affecting individuals with this disease.
Objective: To measure neurocognitive dysfunction in neurologically asymptomatic adults with SCA vs healthy control individuals.
Design, setting, and participants: Cross-sectional study comparing neuropsychological function and neuroimaging findings in neurologically asymptomatic adults with SCA and controls from 12 SCA centers, conducted between December 2004 and May 2008. Participants were patients with SCA (hemoglobin [Hb] SS and hemoglobin level < or = 10 mg/dL) aged 19 to 55 years and of African descent (n = 149) or community controls (Hb AA and normal hemoglobin level) (n = 47). Participants were stratified on age, sex, and education.
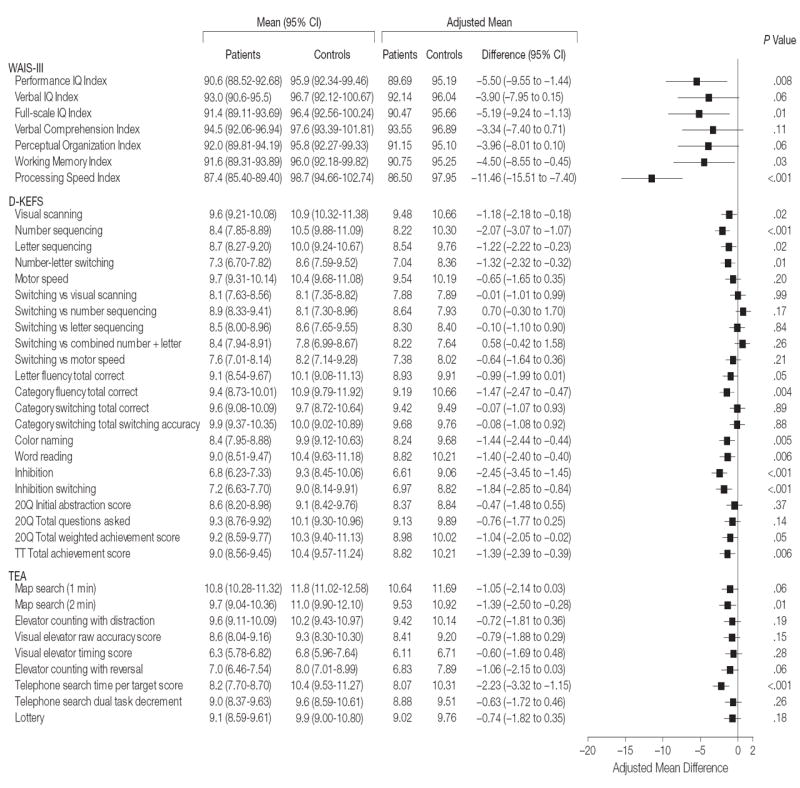
Main outcome measures: The primary outcome measure was nonverbal function assessed by the Wechsler Adult Intelligence Scale, third edition (WAIS-III) Performance IQ Index. Secondary exploratory outcomes included performance on neurocognitive tests of executive function, memory, attention, and language and magnetic resonance imaging measurement of total intracranial and hippocampal volume, cortical gray and white matter, and lacunae.
Results: The mean WAIS-III Performance IQ score of patients with SCA was significantly lower than that of controls (adjusted mean, 86.69 for patients with SCA vs 95.19 for controls [mean difference, -5.50; 95% confidence interval {CI}, -9.55 to -1.44]; P = .008), with 33% performing more than 1 SD (<85) below the population mean. Among secondary measures, differences were observed in adjusted mean values for global cognitive function (full-scale IQ) (90.47 for patients with SCA vs 95.66 for controls [mean difference, -5.19; 95% CI, -9.24 to -1.13]; P = .01), working memory (90.75 vs 95.25 [mean difference, -4.50; 95% CI, -8.55 to -0.45]; P = .03), processing speed (86.50 vs 97.95 [mean difference, -11.46; 95% CI, -15.51 to -7.40]; P < .001), and measures of executive function. Anemia was associated with poorer neurocognitive function in older patients. No differences in total gray matter or hippocampal volume were observed. Lacunae were more frequent in patients with SCA but not independently related to neurocognitive function.
Conclusion: Compared with healthy controls, adults with SCA had poorer cognitive performance, which was associated with anemia and age.
Figures
Comment in
-
Neurocognitive complications of sickle cell anemia in adults.JAMA. 2010 May 12;303(18):1862-3. doi: 10.1001/jama.2010.610. JAMA. 2010. PMID: 20460628 No abstract available.
References
-
- Platt OS, Brambilla DJ, Rosse WF, et al. Mortality in sickle cell disease: life expectancy and risk factors for early death. N Engl J Med. 1994;330(23):1639–1644. - PubMed
-
- Powars DR, Chan LS, Hiti A, Ramicone E, Johnson C. Medicine (Baltimore) 6. Vol. 84. 2005. Outcome of sickle cell anemia: a 4-decade observational study of 1056 patients; pp. 363–376. - PubMed
-
- Ohene-Frempong K, Weiner SJ, Sleeper LA, et al. Cerebrovascular accidents in sickle cell disease: rates and risk factors. Blood. 1998;91(1):288–294. - PubMed
-
- Manfrè L, Giarratano E, Maggio A, Banco A, Vaccaro G, Lagalla R. MR imaging of the brain: findings in asymptomatic patients with thalassemia intermedia and sickle cell-thalassemia disease. AJR Am J Roentgenol. 1999;173(6):1477–1480. - PubMed
