. 2022 Jun 29:13:902837.
doi: 10.3389/fimmu.2022.902837. eCollection 2022.

Exposing and Overcoming Limitations of Clinical Laboratory Tests in COVID-19 by Adding Immunological Parameters; A Retrospective Cohort Analysis and Pilot Study

Collaborators, Affiliations

Exposing and Overcoming Limitations of Clinical Laboratory Tests in COVID-19 by Adding Immunological Parameters; A Retrospective Cohort Analysis and Pilot Study

Adrián Sánchez-Montalvá et al. Front Immunol. .

Abstract

Background: Two years since the onset of the COVID-19 pandemic no predictive algorithm has been generally adopted for clinical management and in most algorithms the contribution of laboratory variables is limited.

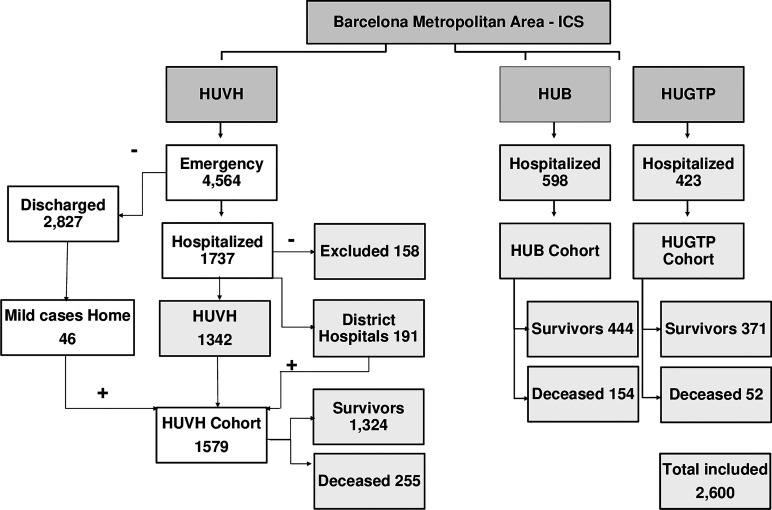
Objectives: To measure the predictive performance of currently used clinical laboratory tests alone or combined with clinical variables and explore the predictive power of immunological tests adequate for clinical laboratories. Methods: Data from 2,600 COVID-19 patients of the first wave of the pandemic in the Barcelona area (exploratory cohort of 1,579, validation cohorts of 598 and 423 patients) including clinical parameters and laboratory tests were retrospectively collected. 28-day survival and maximal severity were the main outcomes considered in the multiparametric classical and machine learning statistical analysis. A pilot study was conducted in two subgroups (n=74 and n=41) measuring 17 cytokines and 27 lymphocyte phenotypes respectively.

Findings: 1) Despite a strong association of clinical and laboratory variables with the outcomes in classical pairwise analysis, the contribution of laboratory tests to the combined prediction power was limited by redundancy. Laboratory variables reflected only two types of processes: inflammation and organ damage but none reflected the immune response, one major determinant of prognosis. 2) Eight of the thirty variables: age, comorbidity index, oxygen saturation to fraction of inspired oxygen ratio, neutrophil-lymphocyte ratio, C-reactive protein, aspartate aminotransferase/alanine aminotransferase ratio, fibrinogen, and glomerular filtration rate captured most of the combined statistical predictive power. 3) The interpretation of clinical and laboratory variables was moderately improved by grouping them in two categories i.e., inflammation related biomarkers and organ damage related biomarkers; Age and organ damage-related biomarker tests were the best predictors of survival, and inflammatory-related ones were the best predictors of severity. 4) The pilot study identified immunological tests (CXCL10, IL-6, IL-1RA and CCL2), that performed better than most currently used laboratory tests.

Conclusions: Laboratory tests for clinical management of COVID 19 patients are valuable but limited predictors due to redundancy; this limitation could be overcome by adding immunological tests with independent predictive power. Understanding the limitations of tests in use would improve their interpretation and simplify clinical management but a systematic search for better immunological biomarkers is urgent and feasible.

Keywords: CXCL10; SARS-CoV-2 infection; acute phase reactants; chemokines; clinical laboratory tests; cytokines; flow cytometry; predictive risk-profile.


Conflict of interest statement

The authors declare that the research was conducted in the absence of any commercial or financial relationships that could be construed as a potential conflict of interest.

Figures

Figure 1
Figure 1
Selection of patients for the cohorts from Vall d’Hebron University Hospital (HUVH), Bellvitge University Hospital (HUB), and Germans Trias i Pujol University Hospital (HUGTP). All patients were confirmed by polymerase chain reaction (PCR) to have coronavirus disease (COVID-19). The details of the excluded patients are provided in Table S1 . The data from HUVH corresponds to patients who were admitted to the emergency division between 10 March and 29 April 2020; to HUGTP between 17 March and 12 May 2020; and to HUB between 16 March and 23 September 2020. The number of deceased patients corresponds to the 28-day follow-up period. The HUB and HUGTP cohorts include only hospitalised patients but in the HUVH cohort, 46 patients were discharged home or to a medicalized hotel within 24h and monitored by the primary care network.
Figure 2
Figure 2
The structure and outcomes of the Vall d’Hebron University Hospital cohort. (A) Left panel, age distribution of the survivors and that of the deceased is markedly different (median [IQR]: 62 years [50–75 years] vs. 82 years [74–87 years], p<0.001) as are comorbidities (central panel) and SpO2/FiO2 (right panel). (B) Distribution of the patients in the HUVH cohort among the four severity categories, based on the World Health Organization criteria (described in the Material and Methods section). The number of patients in the mild category is small (n=71) as only patients with bilateral pneumonia or severe associated pathologies were hospitalised during this period of the pandemic. (C) Survival after admission: this graph highlights mortality during the initial 10 days, with a high number of patients older than 80 years dying in the initial 3–4 days (see text “Overall Clinical Features of HUVH cohort”). HUVH, Vall d’Hebron University Hospital ****p < 0.0001.
Figure 3
Figure 3
Univariate comparisons of a selection of clinical laboratory-derived variables at admission and 28-days survival for the survival/decease and non-severe, severe outcomes in the Vall d’Hebron University Hospital cohort. n, number of cases plotted; NLR, neutrophil-to-lymphocyte ratio; CRP, C-reactive protein; AST, aspartate aminotransferase; ALT, alanine aminotransferase; GFR, glomerular filtration rate. ****p < 0.0001. When non-significant, the numerical p-values are given. The exact p-values are given in Table 2 . The distribution of age and GFR are markedly different in both the severity and survival analysis.
Figure 4
Figure 4
Overall correlograms of selected data on demographics and clinical laboratory variables that were organised in categories. [1] The blue rectangle highlights the negative correlation between neutrophils and the cluster of lymphocytes, monocytes, and eosinophils. [2] The green rectangle highlights the blood cell variables that correlate positively with the acute-phase reactants (APRs) and coagulation factors. [3] The orange rectangle highlights the negative correlation between lymphocytes, monocytes, and eosinophils with APRs and coagulation factors. [4] The magenta rectangle highlights the correlations between age, disease severity, comorbidities with liver and kidney function and SpO2/FiO2. The cells following the diagonal highlights the seven families of variables: clinical, blood cells, APR-coagulation, liver, kidney and lung tests, which show the expected strong correlations among themselves. The thick lines between rows separate the main categories. APR, acute-phase reactants; SpO2/FiO2, oxygen saturation/fraction of inspired oxygen; NLR, neutrophil-to-lymphocyte ratio; CRP, C-reactive protein; AST, aspartate aminotransferase; ALT, alanine aminotransferase; GFR, estimated glomerular filtration rate. The r- and p-values of the data represented in the heatmap are in xlsx format files in the supplementary material “Correlation of variables, r-values” and “Correlation of variables, p-values”.
Figure 5
Figure 5
Relative weight of different variables in prediction and performance. (A) Heatmap summarizing the values under the curve (AUC) generated by applying Receiver Operating Characteristic (ROC) curve routinely used to assed the performance of clinical laboratory tests, to each the main variables; the performance was assessed by survival/decease and for non-severity/severity outcomes in the HUVH cohort. (B) Hazard ratios corresponding to survival curves for Youden index cut-off. Red, significant values for the HUVH cohort. (C) Heatmap of the area under the curve (AUC) of ROC curves corresponding to the variables available for the three cohorts (HUB, HGTP and HUVH). The values have grouped by unbiased hierarchical clustering. IL-6, CRP, urea, lymphocytes, and neutrophils occupy central positions. At the bottom, the AUC for some variables available only from the HUVH cohort and the AUC values for the three cytokines that perform better in the group of 74 patients who were analyzed in the HUVH cohort. The numbers within the cells are the AUC values. (D). Multivariable logistic regression analysis, age-adjusted, for the main variables of the three cohorts (HUB, HGTP and HUVH). The three forest plots show how, after correcting for age, the APRs rank above the glomerular filtration rate (GFR) in the HUVH cohort and have a similar ranking in the three cohorts. The horizontal whiskers represent the 95% confidence intervals; values in red indicate positive predictive and blue negative predictive value for the 28-day survival/deceased outcome. The dotted lines indicate variables only available for HUVH. The OR rankings -differently from the ROC AUCs- are useful only to compare the different hospital cohorts, but not to compare the weight of the variables within each cohort, as ORs are derived from variables that use different units and ranges of variation. APR, acute-phase reactants. APR, acute-phase reactants; SpO2/FiO2, oxygen saturation/fraction of inspired oxygen; NLR, neutrophil-to-lymphocyte ratio; CRP, C-reactive protein; AST, aspartate aminotransferase; ALT, alanine aminotransferase; GFR, glomerular filtration rate; IL, interleukin; LDH, lactate dehydrogenase; Hb, hemoglobin; ROC, receiver-operating characteristic curve; AUC, area under the curve; HUB, Hospital Universitari Bellvitge, HUGTP, Hospital Universitari Germans Trias Pujol Hospital; HUVH, Universitari Vall Hebron.
Figure 6
Figure 6
Vall d’Hebron University Hospital cohort, variations in the average clinical laboratory variables during the 28-day follow-up period. The blue and red lines represent the mean ± CI values of the parameter for each day of follow-up for the survivors and deceased respectively. The blue bars indicate the number of values available for each day. Notice that samples were not obtained every day and therefore the averages result from plotting together all available values for each day of follow-up, as in . Data correspond to 7,586 samples, 6,589 from survivors and 997 from deceased out of 1,079 patients of the HUVH cohort. NLR, neutrophil-to-lymphocyte ratio; CRP, C-reactive protein; AST, aspartate aminotransferase; ALT, alanine aminotransferase; GFR, glomerular filtration rate; IFRB, inflammation-related biomarkers, ODBRs, organ damage-related biomarkers. APRs, acute-phase reactants.
Figure 7
Figure 7
Levels of cytokines and related factors in the Vall d’Hebron University Hospital cytokine studies sub-cohort. The levels of cytokines were measured in the ELLA® platform cytokines on days 0 and +2, and the changes in the levels are shown as before/after graphs. (A) cytokines mediating innate immunity and (B) Granzyme N, IFN-alpha plus cytokines mediating mostly adaptive immunity. Outliers, defined as values above mean + 2SD were identified for seven values. The three single confirmed outlier values for IL6, CXCL10 and CCL2 correspond to an early sample (day 3) of the same patient, a 44-years-old male born, in South America, without comorbidities, with severe COVID; despite the cytokine storm this patient survived and was discharged after over six weeks in hospital, four of them at the ICU with mechanical ventilation. He received two doses of TCZ as part of the treatment. Another three confirmed outlier values for IL-15, IL-12p70 and GM-CSF corresponded to early samples from a single patient, a 61-year-old female with severe pneumonia, chronic lung disease, hypertension, and obesity as risk factors; she survived and was discharged after 30 days in hospital most of them in the ICU with mechanical ventilation. A third patient, with had a single outlier value for IFN-alpha corresponded to a 61-year-old female, with diabetes and hypertension; she suffered moderate COVID, remained at the regular hospital ward and was discharged after two weeks; patients was doing well at censoring time *p < 0.05; **p < 0.01; ***p < 0.001; ****p < 0.0001.
Figure 8
Figure 8
Representative flow cytometry plots from the Vall d’Hebron University Hospital sub-cohort. (A) CD4 and (B) CD8 T lymphocyte subpopulations distributed by phenotypes based on CD45RA and CCR7. (C) CD4 T lymphocyte Th-polarisation by CXCR3 and CCR6 expression. (D) Monocyte subpopulations (classical, intermediate monocytes [IM] and non-classical monocytes) in a comparison of patients belonging to the deceased, severe, and moderate patient categories. (E) Distribution of CD4 naïve and memory subsets among non-severe and severe patients. (F) Distribution of CD8 naïve and memory subsets among non-severe and severe patients; (G) Distribution of CD4 Th polarized subsets among non-severe and severe patients; (H) Distribution of monocytes subsets among non-severe and severe patients; (I) Mean Fluorescent Intensity (MFI) of CD14 and CD16 in the different monocyte subsets among non-severe and severe patients. Non severe patients n=32 and severe patients n=9, for all plots; ****p < 0.0001 by non-parametric FDR corrected Kruskal-Wallis test.

References

    1. Chams N, Chams S, Badran R, Shams A, Araji A, Raad M, et al. COVID-19: A Multidisciplinary Review. Front Public Health (2020) 8:383. doi: 10.3389/fpubh.2020.00383 - DOI - PMC - PubMed
    1. Ghayda RA, Lee J, Lee JY, Kim DK, Lee KH, Hong SH, et al. Correlations of Clinical and Laboratory Characteristics of Covid-19: A Systematic Review and Meta-Analysis. Int J Environ Res Public Health (2020) 17:1–15. doi: 10.3390/ijerph17145026 - DOI - PMC - PubMed
    1. Zhou F, Yu T, Du R, Fan G, Liu Y, Liu Z, et al. Clinical Course and Risk Factors for Mortality of Adult Inpatients With COVID-19 in Wuhan , China : A Retrospective Cohort Study. Lancet (2020) 6736:1–9. doi: 10.1016/S0140-6736(20)30566-3 - DOI - PMC - PubMed
    1. Abers MS, Delmonte OM, Ricotta EE, Fintzi J, Fink DL, Almeida de Jesus AA, et al. An Immune-Based Biomarker Signature Is Associated With Mortality in COVID-19 Patients. JCI Insight (2021) 6:m1985. doi: 10.1172/jci.insight.144455 - DOI - PMC - PubMed
    1. Guallar MP, Meiriño R, Donat-Vargas C, Corral O, Jouvé N, Soriano V. Inoculum at the Time of SARS-CoV-2 Exposure and Risk of Disease Severity. Int J Infect diseases (2020) 97:290–2. doi: 10.1016/j.ijid.2020.06.035 - DOI - PMC - PubMed

Publication types