. 2005 Apr;3(4):e100.
doi: 10.1371/journal.pbio.0030100. Epub 2005 Mar 22.

The N. gonorrhoeae type IV pilus stimulates mechanosensitive pathways and cytoprotection through a pilT-dependent mechanism

Affiliations

The N. gonorrhoeae type IV pilus stimulates mechanosensitive pathways and cytoprotection through a pilT-dependent mechanism

Heather L Howie et al. PLoS Biol. 2005 Apr.

Abstract

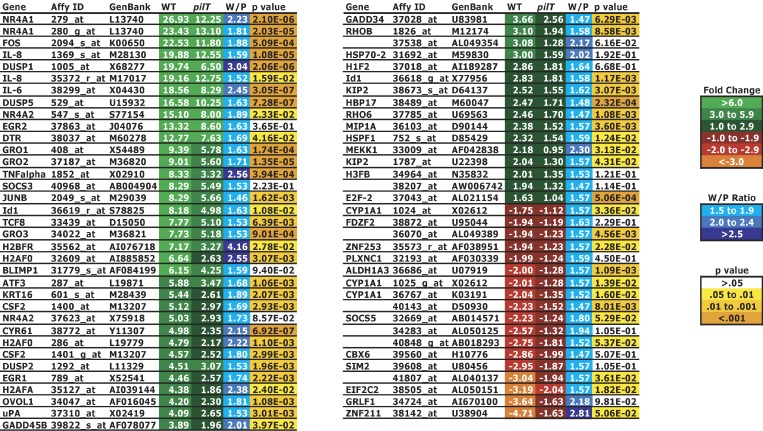
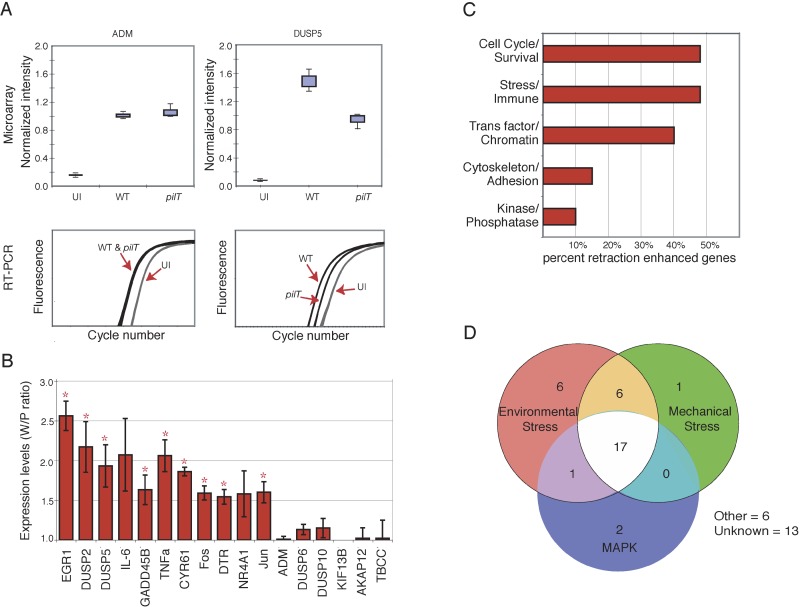
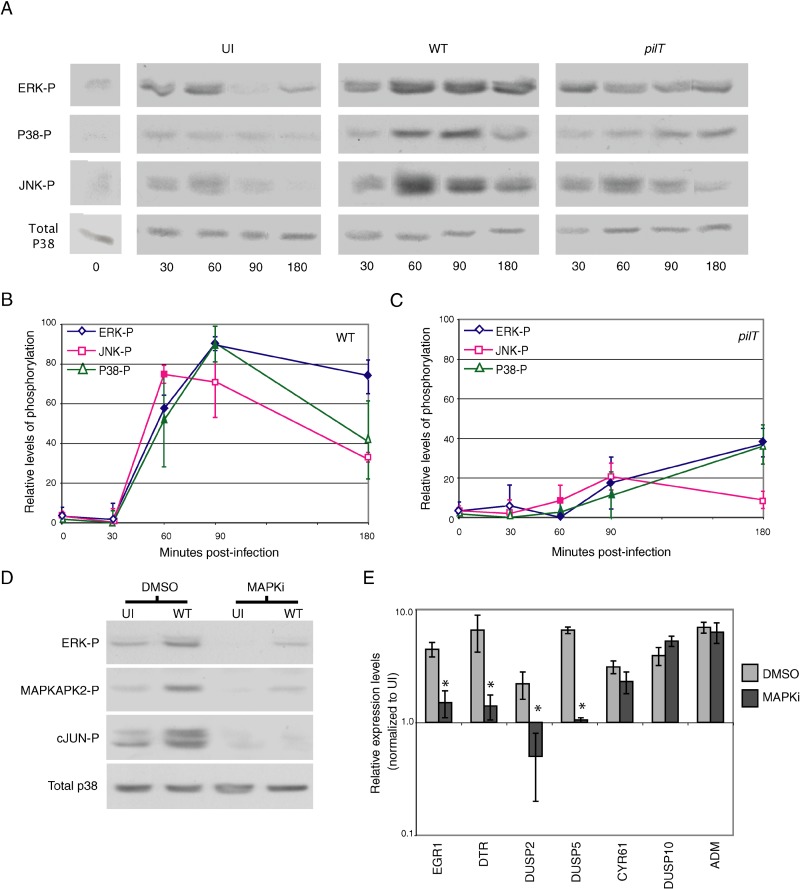
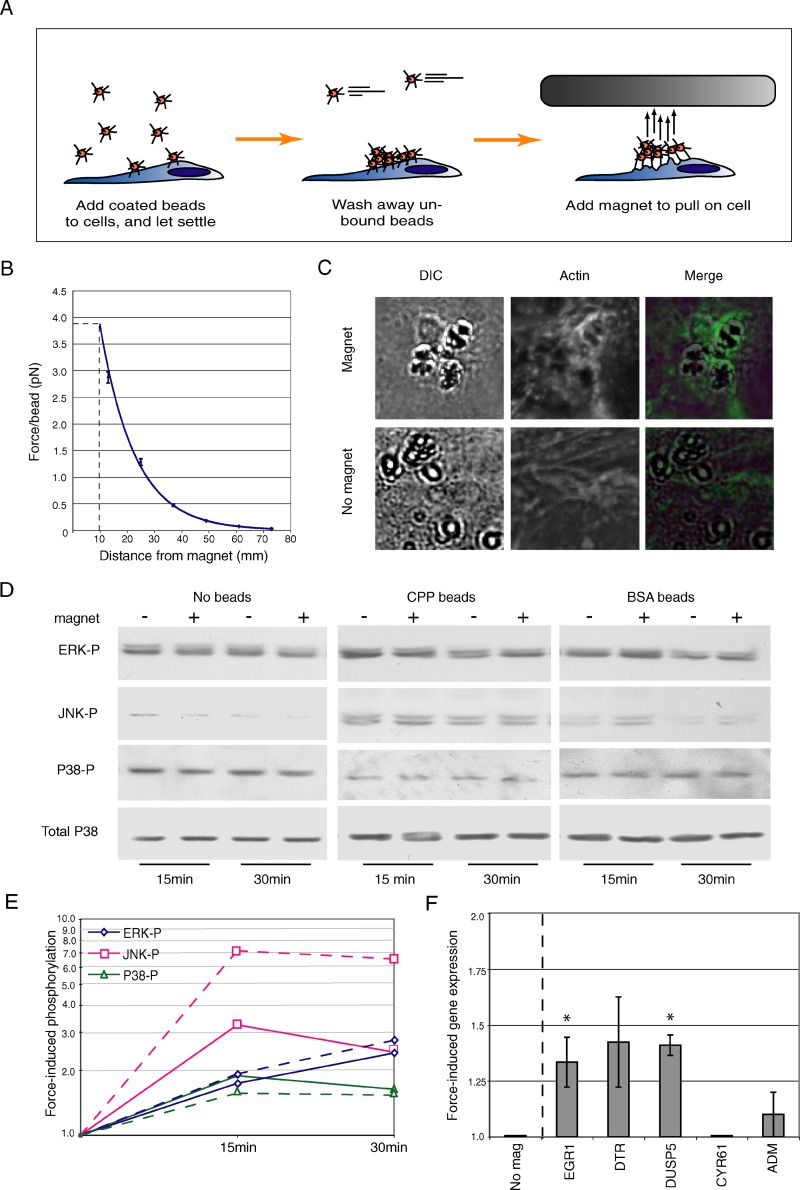
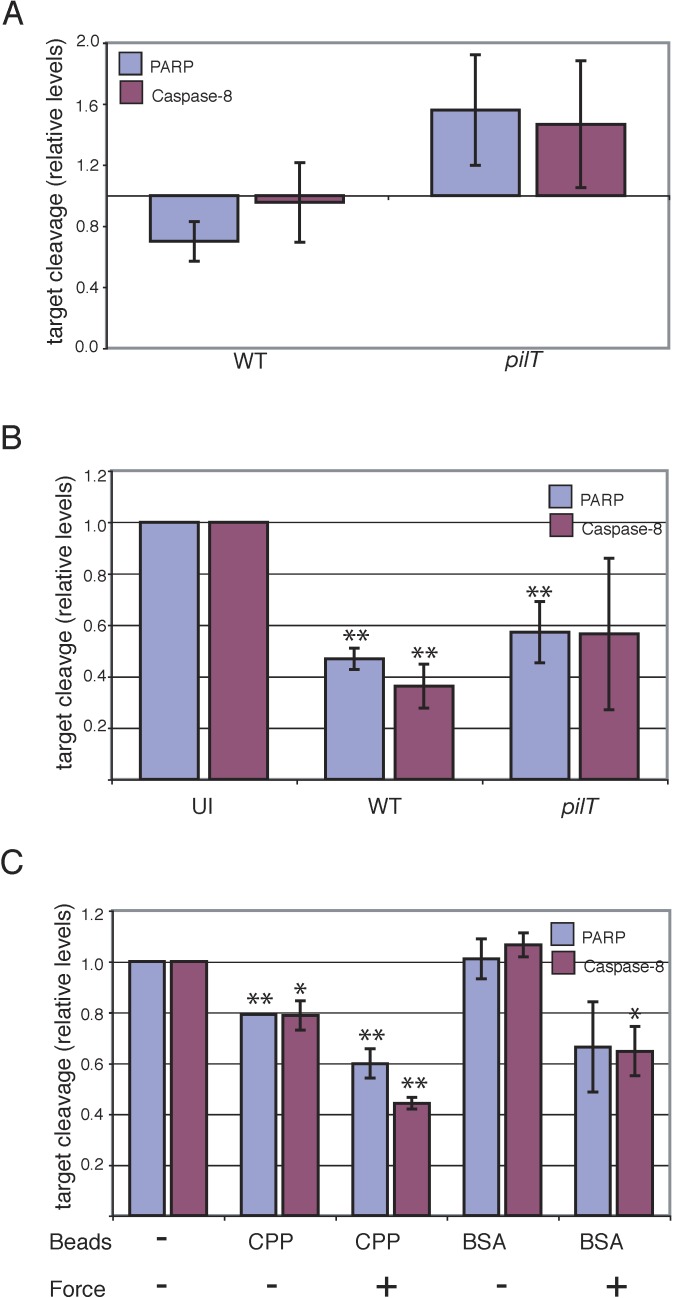
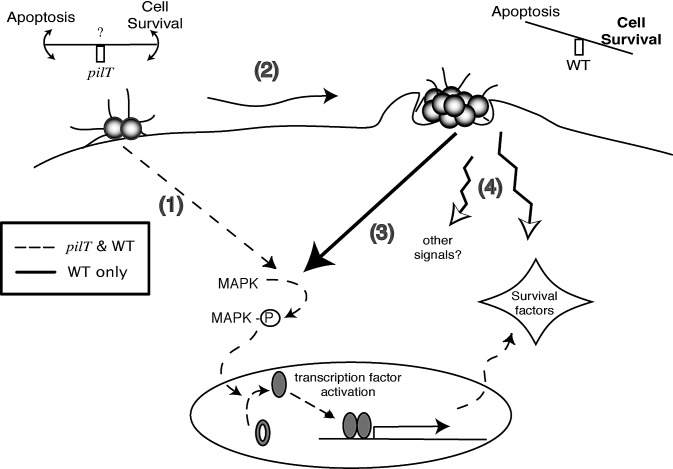
The Neisseria gonorrhoeae type IV pilus is a retractile appendage that can generate forces near 100 pN. We tested the hypothesis that type IV pilus retraction influences epithelial cell gene expression by exerting tension on the host membrane. Wild-type and retraction-defective bacteria altered the expression of an identical set of epithelial cell genes during attachment. Interestingly, pilus retraction, per se, did not regulate novel gene expression but, rather, enhanced the expression of a subset of the infection-regulated genes. This is accomplished through mitogen-activated protein kinase activation and at least one other undefined stress-activated pathway. These results can be reproduced by applying artificial force on the epithelial membrane, using a magnet and magnetic beads. Importantly, this retraction-mediated signaling increases the ability of the cell to withstand apoptotic signals triggered by infection. We conclude that pilus retraction stimulates mechanosensitive pathways that enhance the expression of stress-responsive genes and activate cytoprotective signaling. A model for the role of pilus retraction in influencing host cell survival is presented.


Figures

Figure 1
Figure 1. Infection-Regulated, Retraction-Enhanced Epithelial Cell Genes
Wt and pilT values represent the mean fold-change in the transcript level of each gene in infected cells compared to uninfected cells (n = 2). W/P values represent the degree of enhancement of gene expression resulting from pilus retraction and are the result of dividing the wt fold-change value by the pilT fold-change value from two independent experiments. The p-value for each gene represents the statistical significance of the difference in its expression level (as determined by Cyber-T analysis) between wt and pilT. The color code assigned to each gene represents its degree of response to infection as expressed by its fold-change value, W/P, and p-value.
Figure 2
Figure 2. Real-Time Quantitative RT-PCR Verification of Microarray Results and Initial Characterization of Retraction-Enhanced Genes
(A) Microarray (top panels) and real-time quantitative RT-PCR (bottom panels) expression profiles of ADM and DUSP5 in uninfected cells (UI), N400-infected cells (WT), and N400pilT-infected cells(pilT). Microarray data are shown as box-plots (n = 3). RT-PCR data are plotted as triplicate samples from one representative experiment. (B) Real-time quantitative RT-PCR verification of retraction-enhanced expression of selected genes. Data are expressed as average W/P (±SEM, n = 3). Genes with a W/P statistically greater than 1.0 (p < 0.05) are denoted with an asterisk. (C) Grouping of retraction-enhanced genes according to function, based on published reports (see Table S1). Some genes have multiple functions and thus appear in more than one group. (D) Genes in this study that are known to be induced by environmental stress, mechanical stress, or MAPK signaling (see Table S1).
Figure 3
Figure 3. Levels of Activated MAPK in Infected Cells and Their Involvement in Retraction-Enhanced Gene Expression
(A) Representative immunoblot showing ERK-p, P38-p, and JNK-p, in uninfected cells before (0 h) and after medium change (UI), or in cells infected with N400 (WT) or N400pilT (pilT). Total P38 protein levels in each sample served as the internal control (bottom lanes). (B and C) ERK-p JNK-p, and P38-p levels over time in cells infected with N400 and N400pilT, respectively. Immunoblots from (A) were analyzed by densitometry, and levels of activated kinase from infected cells were normalized to that from uninfected cells (UI). Values represent mean normalized protein levels (±SEM, n = 2). Solid markers indicate a significant difference between wt and pilT-induced MAPK phosphorylation at that time point (p < 0.05); thus, ERK-p is significant at 60, 90, and 180 min; JNK-p is significant at 60 min; and P38-p is significant at 60 and 90 min. (D) Representative immunoblot showing ERK-p, MAPKAPK2-p, and c-Jun-p in cells preincubated with vehicle (DMSO) or MAPK inhibitors and infected for 90 min with N400 (WT) or left untreated (UI). Total P38 protein levels in each sample served as the internal control (bottom lanes). (E) Real-time quantitative RT-PCR analysis of the effect of MAPK inhibitors on the expression of retraction-responsive genes. Light bars indicate cells infected with N400 in the presence of vehicle (DMSO); dark bars indicate cells infected with N400 in the presence of MAPK inhibitors. Values represent the fold-change (±SEM, n = 2) in transcript levels compared to uninfected, DMSO treated control. A significant difference in expression between the two conditions is denoted by an asterisk (p < 0.1).
Figure 4
Figure 4. Artificial Force Triggers MAPK Phosphorylation and Induces the Expression of Retraction-Enhanced Genes
(A) Representation of the magnet/magnetic bead assay. (B) Average force generated on one bead as a function of magnet distance from the culture dish. Data represent the forces calculated from four identical magnets (±SEM). All subsequent assays were performed using a magnet distance of 10 mm, which corresponds to a force of 4 pN per bead (dotted line). (C) Magnet-induced clustering of actin beneath magnetic beads. CPP-coated beads were seeded onto T84 cells and exposed to the magnet for 1 h (top panels) or left untreated (no magnet, bottom panels). Differential interference contrast images (left panels) reveal the location of the beads; phalloidin staining (middle panels) shows the presence of actin at the same site. Right panels show the two previous images merged. (D) Representative immunoblot of ERK-p, JNK-p, and P38-p in cells seeded with CPP-coated beads, BSA-coated beads, or no beads, and exposed to the magnet for 15 or 30 min. Total P38 protein levels in each sample served as the internal control (bottom panels). (E) Quantitation of ERK-p, JNK-p, and P38-p signals by densitometry from the representative immunoblot shown in (D), normalized to the no-bead control. Solid lines indicate signals from cells exposed to membrane-coated beads; dotted lines indicate signals from cells exposed to BSA-coated beads. (F) Real-time quantitative RT-PCR analysis of the transcript levels of selected genes in cells seeded with CPP beads and exposed to the magnet for 3 h. Data represent the average fold-change (±SEM, n = 2) compared to a no-magnet control. A significant difference in expression on force induction is denoted by an asterisk (p < 0.1).
Figure 5
Figure 5. Pilus Retraction during Bacterial Attachment Promotes Host Cell Cytoprotection
(A) Levels of cleaved PARP and cleaved caspase 8 in T84 cells infected for 6 h with N400 (WT) or N400pilT (pilT), normalized to cleaved PARP or cleaved caspase 8 levels in uninfected cells. (B) Levels of cleaved PARP and cleaved caspase 8 in T84 cells infected with N400 (WT) or N400pilT (pilT) or left uninfected (UI) for 4 h, then incubated with STS (1 μM) for an additional 4 h to induce apoptosis. A significant difference from uninfected cells is denoted by two asterisks (p < 0.05). (C) Cleaved PARP and cleaved caspase 8 levels in cells exposed to magnetic force. T84 cells were seeded with CPP- or BSA-coated beads and exposed to the magnet for 2 h or were left unexposed, then incubated with STS (1 μM) for an additional 4 h away from the magnet. The cleaved PARP and cleaved caspase 8 level in cells without beads and not exposed to magnetic force is arbitrarily assigned a value of 1.0, and all other treatments are expressed relative to this value. For all experiments, cleaved protein levels were quantified by densitometry of immunoblot signals. Values represent the mean levels of cleaved target (±SEM) from two independent experiments. A significant difference from untreated cells is denoted by two asterisks (p < 0.05) or by a single asterisk (p < 0.1).
Figure 6
Figure 6. Model of the Role of Pilus Retraction in Promoting a Cytoprotective Environment during Gonococcal Infection of an Epithelial Cell
(1) Initial contact between the bacterium and host cell activates low levels of MAPK, and transcription of infection-induced genes. This level of signaling may or may not be able to protect the cell from apoptosis; thus, the host cell “teeters” on the edge of life and death. (2) As the infection proceeds, microcolonies of gonococci are formed, and more pili are locally available to retract. (3) Pilus retraction amplifies MAPK activation, which in turn enhances the transcription of mechanical stress–induced genes. (4) Pilus retraction may also stimulate other pathways that mediate gene expression and survival signaling. Overall signaling events tip the balance in favor of cell survival.

References

    1. Mattick JS. Type IV pili and twitching motility. Annu Rev Microbiol. 2002;56:289–314. - PubMed
    1. Wall D, Kaiser D. Type IV pili and cell motility. Mol Microbiol. 1999;32:1–10. - PubMed
    1. O'Toole GA, Kolter R. Flagellar and twitching motility are necessary for Pseudomonas aeruginosa biofilm development. Mol Microbiol. 1998;30:295–304. - PubMed
    1. Bechet M, Blondeau R. Factors associated with the adherence and biofilm formation by Aeromonas caviae on glass surfaces. J Appl Microbiol. 2003;94:1072–1078. - PubMed
    1. Dubnau D. DNA uptake in bacteria. Annu Rev Microbiol. 1999;53:217–244. - PubMed

Publication types

MeSH terms